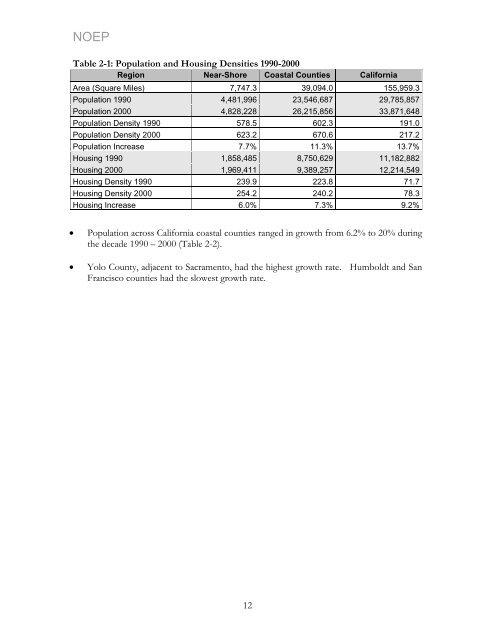
NOEP Table 2-1: Population and Housing Densities 1990-2000 Region Near-Shore Coastal Counties <strong>California</strong> Area (Square Miles) 7,747.3 39,094.0 155,959.3 Population 1990 4,481,996 23,546,687 29,785,857 Population 2000 4,828,228 26,215,856 33,871,648 Population Density 1990 578.5 602.3 191.0 Population Density 2000 623.2 670.6 217.2 Population Increase 7.7% 11.3% 13.7% Housing 1990 1,858,485 8,750,629 11,182,882 Housing 2000 1,969,411 9,389,257 12,214,549 Housing Density 1990 239.9 223.8 71.7 Housing Density 2000 254.2 240.2 78.3 Housing Increase 6.0% 7.3% 9.2% • Population across <strong>California</strong> coastal counties ranged in growth from 6.2% to 20% during the decade 1990 – 2000 (Table 2-2). • Yolo County, adjacent to Sacramento, had the highest growth rate. Humboldt and San Francisco counties had the slowest growth rate. 12
NOEP Table 2-2: Regional Population and Housing Growth Rates Region 2000 Population Population 1990- 2000 Growth Rate 2000 Housing Housing 1990- 2000 Growth Rate North Del Norte 27,507 17.3% 10,434 14.8% Humboldt 126,518 6.2% 55,912 9.3% Mendocino 86,265 7.4% 36,937 9.8% North Region Total 240,290 7.8% 103,283 10.0% North Central Sonoma 458,614 18.1% 183,153 13.7% Marin 247,289 7.5% 104,990 5.3% Napa 124,279 12.2% 48,554 9.9% Solano 394,542 16.2% 134,513 12.5% Yolo 168,660 19.4% 61,587 16.2% Sacramento 1,223,499 17.5% 474,814 13.7% San Joaquin 563,598 17.3% 189,160 13.8% San Francisco 776,733 7.3% 346,527 5.5% Alameda 1,443,741 10.7% 540,183 7.2% Contra Costa 948,816 18.1% 354,577 12.2% Santa Clara 1,682,585 12.4% 579,329 7.2% North Central Total 8,032,356 13.8% 3,017,387 9.7% Central San Mateo 707,161 8.9% 260,576 3.5% Santa Cruz 255,602 11.3% 98,873 7.6% Monterey 401,762 13.0% 131,708 8.7% Central Region Total 1,364,525 10.5% 491,157 5.7% South Central San Luis Obispo 246,681 13.6% 102,275 13.4% Santa Barbara 399,347 8.1% 142,901 3.4% Ventura 753,197 12.6% 251,712 10.2% South Central Total 1,399,225 11.4% 496,888 8.8% South Los Angeles 9,519,338 7.4% 3,270,909 3.4% Orange 2,846,289 18.1% 969,484 10.8% San Diego 2,813,833 12.6% 1,040,149 9.9% South Region Total 15,179,460 10.2% 5,280,542 5.9% Total Coastal 26,215,856 11.3% 9,389,257 7.3% <strong>California</strong> Total 33,871,648 13.7% 12,214,549 9.2% 13
- Page 1 and 2: NOEP CALIFORNIA’S OCEAN ECONOMY R
- Page 3 and 4: NOEP Table of Contents Executive Su
- Page 5 and 6: NOEP PART IV APPENDIX .............
- Page 7 and 8: NOEP Table 6-4: 2000 Employment, Wa
- Page 9 and 10: NOEP Figure 8-4: Fishing and Boatin
- Page 11 and 12: NOEP Executive Summary California
- Page 13 and 14: NOEP Acknowledgements The State of
- Page 15 and 16: NOEP PART I BACKGROUND AND SUMMARY
- Page 17 and 18: NOEP ocean and economic activity, s
- Page 19 and 20: NOEP The use of SIC codes and geogr
- Page 21: NOEP Chapter 2 Summary of Findings
- Page 25 and 26: NOEP Table 2-5: Growth Rates for Co
- Page 27 and 28: NOEP 2.4 California’s Ocean Econo
- Page 29 and 30: NOEP 2.5 California’s Ocean Econo
- Page 31 and 32: NOEP Table 2-10: California Ocean E
- Page 33 and 34: NOEP Figure 2-5 shows that the prop
- Page 35 and 36: NOEP Number of Workers 1,000,000 10
- Page 37 and 38: NOEP 2.7 Indirect and Induced Estim
- Page 39 and 40: NOEP • Construction trends in mar
- Page 41 and 42: NOEP PART II THE SECTORS OF THE CAL
- Page 43 and 44: NOEP assess: a) Landings and landed
- Page 45 and 46: NOEP Billion Pounds 12 10 8 6 4 2 0
- Page 47 and 48: NOEP Percentage 25% 20% 15% 10% 5%
- Page 49 and 50: NOEP in terms of revenue, replacing
- Page 51 and 52: NOEP Figure 3-6 shows the landings
- Page 53 and 54: NOEP Thousands of Wet Tons 200 180
- Page 55 and 56: NOEP 3.4 Conclusion Living Resource
- Page 57 and 58: NOEP Chapter 4 California Ocean Min
- Page 59 and 60: NOEP Table 4-3: California Offshore
- Page 61 and 62: NOEP Table 4-6: Coastal Counties On
- Page 63 and 64: NOEP are concentrated in less than
- Page 65 and 66: NOEP Chapter 5 California Marine Tr
- Page 67 and 68: NOEP million tons of foreign cargo
- Page 69 and 70: NOEP 120,000,000 100,000,000 80,000
- Page 71 and 72: NOEP From 1992 to 2001, total value
- Page 73 and 74:
NOEP Table 5-4: Port Rankings 2001
- Page 75 and 76:
NOEP 5.2 CA Water Transportation: R
- Page 77 and 78:
NOEP Table 5-9: Warehousing (SIC co
- Page 79 and 80:
NOEP Table 5-11: Marine Passenger T
- Page 81 and 82:
NOEP Table 5-13: Search and Navigat
- Page 83 and 84:
NOEP 5.2 References California Mari
- Page 85 and 86:
NOEP Chapter 6 California Marine Co
- Page 87 and 88:
NOEP 6.2.1 Historical Capital Expen
- Page 89 and 90:
NOEP 60.0% 50.0% 40.0% 30.0% 20.0%
- Page 91 and 92:
NOEP CA Share of Total U.S. Port Ca
- Page 93 and 94:
NOEP 40 35 30 25 20 15 10 5 0 US Po
- Page 95 and 96:
NOEP 6.2.2 Proposed Capital Expendi
- Page 97 and 98:
NOEP 2,500 2,000 1,500 1,000 500 0
- Page 99 and 100:
NOEP CA Share of Capital Expenditur
- Page 101 and 102:
NOEP 6.2.4 Economic Impact The foll
- Page 103 and 104:
NOEP 6.3 Beach Nourishment 39 In Ca
- Page 105 and 106:
NOEP Table 6-6: Funding for Califor
- Page 107 and 108:
NOEP Chapter 7: California Ship & B
- Page 109 and 110:
NOEP research ships for commercial
- Page 111 and 112:
NOEP 7.3 References CA Employment D
- Page 113 and 114:
NOEP Chapter 8 Coastal Tourism & Re
- Page 115 and 116:
NOEP volume and diversity, along th
- Page 117 and 118:
NOEP participated in marine recreat
- Page 119 and 120:
NOEP 8.2.2 California Beach Valuati
- Page 121 and 122:
NOEP No attempt has been made to es
- Page 123 and 124:
NOEP 8.2.3 Recreational Fishing and
- Page 125 and 126:
NOEP 14,000,000 12,000,000 10,000,0
- Page 127 and 128:
NOEP The travel industry supported
- Page 129 and 130:
NOEP 8.4 Regional Estimates of Cali
- Page 131 and 132:
NOEP Table 8-16 Cont. SIC4 Region N
- Page 133 and 134:
NOEP Table 8-17 summarizes the tota
- Page 135 and 136:
NOEP 8.5 References California Fast
- Page 137 and 138:
NOEP PART III CONCLUSION Future Dir
- Page 139 and 140:
NOEP PART IV APPENDIX Appendix A: T
- Page 141 and 142:
NOEP All ES-202 data are reported t
- Page 143 and 144:
NOEP At the same time, this data se
- Page 145 and 146:
NOEP fishing, or boating will not o
- Page 147 and 148:
NOEP Table B-1: Commercial Fisherie
- Page 149 and 150:
NOEP Appendix C: California Marine
- Page 151 and 152:
NOEP Appendix D: California Beaches
- Page 153 and 154:
NOEP Table D-1: Regional Beaches an
- Page 155 and 156:
NOEP Table D-1: Regional Beaches an
- Page 157 and 158:
NOEP Table D-2: Regional Beaches fr
- Page 159 and 160:
NOEP Table D-2: Regional Beaches fr
- Page 161 and 162:
NOEP Region County Beach Gray Whale
- Page 163 and 164:
NOEP Region County Beach San Luis O
- Page 165 and 166:
NOEP Region County Beach La Piedra