

California's Ocean Economy - California Resources Agency - State ...
California's Ocean Economy - California Resources Agency - State ...
California's Ocean Economy - California Resources Agency - State ...

Create successful ePaper yourself
Turn your PDF publications into a flip-book with our unique Google optimized e-Paper software.
NOEP<br />
2.6 <strong>California</strong>’s <strong>Ocean</strong> <strong>Economy</strong>: <strong>State</strong>wide Summaries by Sector<br />
• The direct market value, or GSP, of <strong>California</strong>’s <strong>Ocean</strong> <strong>Economy</strong> was $21.4 billion in<br />
2000. Total market value, or GSP in 2000 was $42.9 billion.<br />
The ocean-related GSP grew by 10.64% in constant 2000 dollars between 1990 and 2000.<br />
This lagged behind <strong>California</strong>’s overall economic growth. This lagging trend in growth was<br />
similar to the nation.<br />
• The Marine Minerals and Coastal Recreation & Tourism sectors increased in GSP.<br />
• <strong>California</strong>’s <strong>Ocean</strong> <strong>Economy</strong> directly provided over 400,000 jobs in 2000, and more than<br />
690,000 jobs when multiplier effects are considered.<br />
• Employment in <strong>California</strong>’s <strong>Ocean</strong> <strong>Economy</strong> grew more slowly than the state’s overall<br />
economy. Wage and salary jobs in the <strong>Ocean</strong> <strong>Economy</strong> grew approximately 4.9%,<br />
compared with 13.8% overall growth in <strong>California</strong>. The increase was almost entirely due<br />
to growth in Tourism & Recreation jobs in the coastal regions.<br />
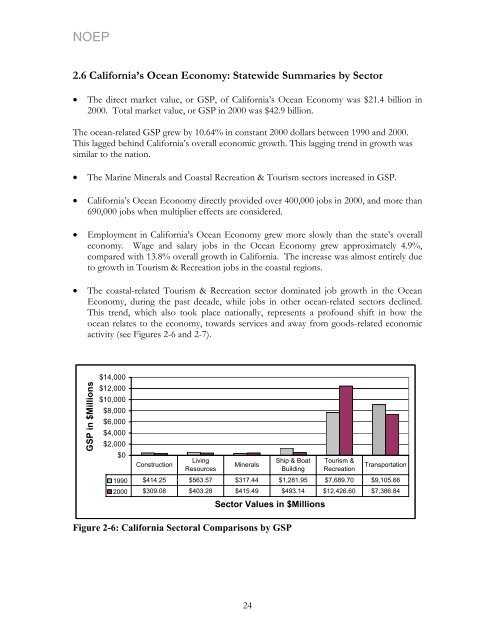
• The coastal-related Tourism & Recreation sector dominated job growth in the <strong>Ocean</strong><br />
<strong>Economy</strong>, during the past decade, while jobs in other ocean-related sectors declined.<br />
This trend, which also took place nationally, represents a profound shift in how the<br />
ocean relates to the economy, towards services and away from goods-related economic<br />
activity (see Figures 2-6 and 2-7).<br />
GSP in $Millions<br />
$14,000<br />
$12,000<br />
$10,000<br />
$8,000<br />
$6,000<br />
$4,000<br />
$2,000<br />
$0<br />
Construction<br />
Living<br />
<strong>Resources</strong><br />
Minerals<br />
Ship & Boat<br />
Building<br />
1990 $414.25 $563.57 $317.44 $1,281.95 $7,689.70 $9,105.66<br />
2000 $309.08 $403.28 $415.49 $493.14 $12,426.60 $7,386.84<br />
Sector Values in $Millions<br />
Figure 2-6: <strong>California</strong> Sectoral Comparisons by GSP<br />
24<br />
Tourism &<br />
Recreation<br />
Transportation


