

California's Ocean Economy - California Resources Agency - State ...
California's Ocean Economy - California Resources Agency - State ...
California's Ocean Economy - California Resources Agency - State ...

Create successful ePaper yourself
Turn your PDF publications into a flip-book with our unique Google optimized e-Paper software.
NOEP<br />
5.2 CA Water Transportation: Regional and <strong>State</strong> Employment and<br />
Income<br />
Direct Economic Impact 31<br />
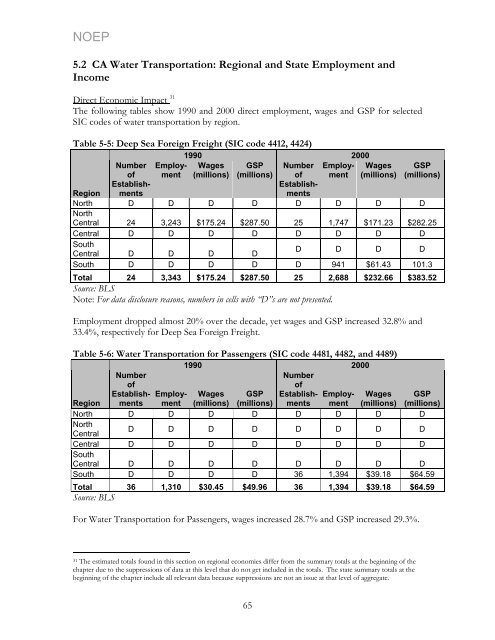
The following tables show 1990 and 2000 direct employment, wages and GSP for selected<br />
SIC codes of water transportation by region.<br />
Table 5-5: Deep Sea Foreign Freight (SIC code 4412, 4424)<br />
1990 2000<br />
Number Employ- Wages GSP Number Employ- Wages GSP<br />
of ment (millions) (millions) of ment (millions) (millions)<br />
EstablishEstablish-<br />
Region mentsments<br />
North<br />
North<br />
D D D D D D D D<br />
Central 24 3,243 $175.24 $287.50 25 1,747 $171.23 $282.25<br />
Central D D D D D D D D<br />
South<br />
Central D D D D<br />
D D D D<br />
South D D D D D 941 $61.43 101.3<br />
Total 24 3,343 $175.24 $287.50 25 2,688 $232.66 $383.52<br />
Source: BLS<br />
Note: For data disclosure reasons, numbers in cells with “D”s are not presented.<br />
Employment dropped almost 20% over the decade, yet wages and GSP increased 32.8% and<br />
33.4%, respectively for Deep Sea Foreign Freight.<br />
Table 5-6: Water Transportation for Passengers (SIC code 4481, 4482, and 4489)<br />
1990 2000<br />
Number<br />
Number<br />
of<br />
of<br />
EstablishEmploy- Wages GSP EstablishEmploy- Wages GSP<br />
Region mentsment (millions) (millions) mentsment (millions) (millions)<br />
North D D D D D D D D<br />
North<br />
Central<br />
D D D D D D D D<br />
Central<br />
South<br />
D D D D D D D D<br />
Central D D D D D D D D<br />
South D D D D 36 1,394 $39.18 $64.59<br />
Total 36 1,310 $30.45 $49.96 36 1,394 $39.18 $64.59<br />
Source: BLS<br />
For Water Transportation for Passengers, wages increased 28.7% and GSP increased 29.3%.<br />
31 The estimated totals found in this section on regional economies differ from the summary totals at the beginning of the<br />
chapter due to the suppressions of data at this level that do not get included in the totals. The state summary totals at the<br />
beginning of the chapter include all relevant data because suppressions are not an issue at that level of aggregate.<br />
65


