

California's Ocean Economy - California Resources Agency - State ...
California's Ocean Economy - California Resources Agency - State ...
California's Ocean Economy - California Resources Agency - State ...

Create successful ePaper yourself
Turn your PDF publications into a flip-book with our unique Google optimized e-Paper software.
NOEP<br />
120,000,000<br />
100,000,000<br />
80,000,000<br />
60,000,000<br />
40,000,000<br />
20,000,000<br />
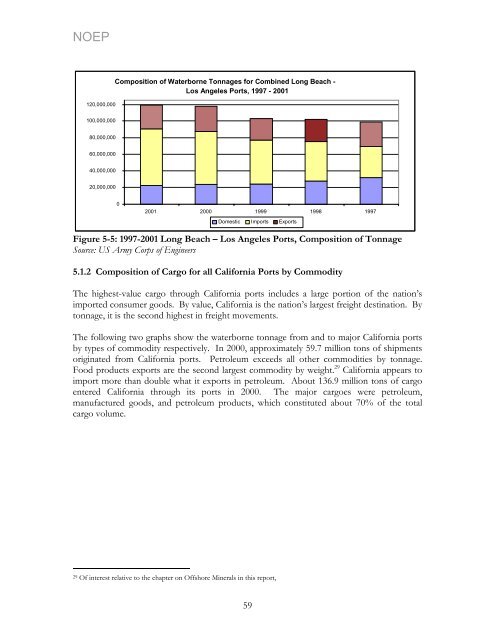
Composition of Waterborne Tonnages for Combined Long Beach -<br />
Los Angeles Ports, 1997 - 2001<br />
0<br />
2001 2000 1999 1998 1997<br />
Domestic Imports Exports<br />
Figure 5-5: 1997-2001 Long Beach – Los Angeles Ports, Composition of Tonnage<br />
Source: US Army Corps of Engineers<br />
5.1.2 Composition of Cargo for all <strong>California</strong> Ports by Commodity<br />
The highest-value cargo through <strong>California</strong> ports includes a large portion of the nation’s<br />
imported consumer goods. By value, <strong>California</strong> is the nation’s largest freight destination. By<br />
tonnage, it is the second highest in freight movements.<br />
The following two graphs show the waterborne tonnage from and to major <strong>California</strong> ports<br />
by types of commodity respectively. In 2000, approximately 59.7 million tons of shipments<br />
originated from <strong>California</strong> ports. Petroleum exceeds all other commodities by tonnage.<br />
Food products exports are the second largest commodity by weight. 29 <strong>California</strong> appears to<br />
import more than double what it exports in petroleum. About 136.9 million tons of cargo<br />
entered <strong>California</strong> through its ports in 2000. The major cargoes were petroleum,<br />
manufactured goods, and petroleum products, which constituted about 70% of the total<br />
cargo volume.<br />
29 Of interest relative to the chapter on Offshore Minerals in this report,<br />
59


