NOEP Table 3-4: Regional Landings and Values 2000-2002 . 2000 2001 2002 Region Weight of landings (lb) Landed Value ($) Weight of Landed landings (lb) Value ($) Weight of landings (lb) Landed Value ($) North Coast 27,711,244 27,057,783 22,080,412 18,908,402 21,904,644 18,227,627 Del Norte 8,114,071 9,779,518 6,533,578 5,856,040 4,496,855 4,430,281 Humboldt 10,102,830 8,410,836 7,209,487 5,690,285 7,853,514 6,380,523 Mendocino 9,494,343 8,867,429 8,337,347 7,362,084 9,554,275 7,146,823 North Central 15,278,570 13,137,260 12,239,073 11,501,424 12,792,633 11,543,997 Alameda 46,594 108,747 79,576 158,831 162,075 235,909 Contra Costa 10,737 27,564 6,747 19,394 13,138 33,038 Marin 1,919,644 1,672,380 2,986,961 2,137,359 364,236 629,607 San Francisco 10,204,780 7,313,606 6,491,229 5,889,007 8,751,549 6,625,709 Santa Clara 388,429 226,042 647,204 219,922 649,801 133,040 Solano 6,444 14,908 Sonoma 2,708,386 3,788,921 2,027,356 3,076,911 2,845,390 3,871,741 Central Coast 65,054,096 14,809,023 66,674,419 12,041,962 99,208,364 16,571,474 Monterey 61,339,436 9,813,590 63,450,017 8,260,265 94,186,314 12,450,017 San Mateo 3,029,606 3,925,871 2,885,194 3,256,384 4,651,711 3,609,970 Santa Cruz 685,054 1,069,562 339,208 525,313 370,339 553,173 South Central Coast 174,848,867 33,230,847 113,480,611 22,341,361 60,231,135 19,225,417 San Luis Obispo 3,661,918 5,718,773 3,469,567 4,604,807 2,848,307 3,773,916 Santa Barbara 7,005,508 6,728,900 5,263,908 5,382,993 5,658,833 6,125,507 Ventura 164,231,441 20,783,174 104,747,136 12,353,561 51,723,995 9,325,994 South Coast 257,328,091 47,170,193 221,378,721 37,309,889 167,451,195 25,937,566 Los Angeles 254,044,639 39,316,639 217,999,578 29,979,777 163,951,419 19,445,966 Orange 548,667 1,774,456 556,041 1,694,446 529,351 1,646,180 San Diego 2,734,785 6,078,956 2,823,102 5,635,666 2,970,425 4,845,180 All Coastal Counties 540,220,868 135,405,106 435,853,236 102,103,038 361,587,971 91,506,081 40
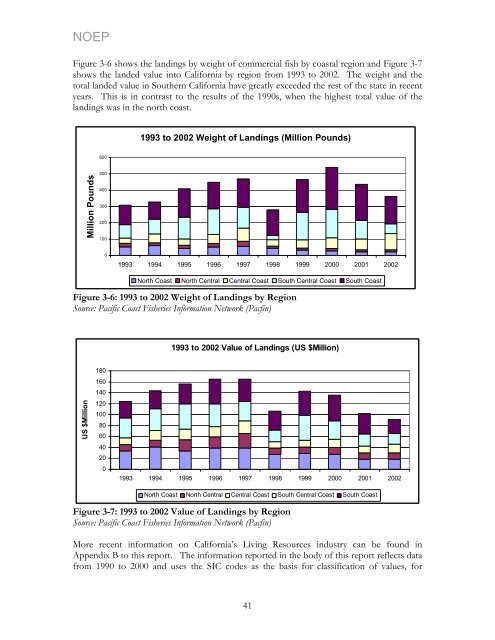
NOEP Figure 3-6 shows the landings by weight of commercial fish by coastal region and Figure 3-7 shows the landed value into <strong>California</strong> by region from 1993 to 2002. The weight and the total landed value in Southern <strong>California</strong> have greatly exceeded the rest of the state in recent years. This is in contrast to the results of the 1990s, when the highest total value of the landings was in the north coast. Million Pounds 600 500 400 300 200 100 0 1993 to 2002 Weight of Landings (Million Pounds) 1993 1994 1995 1996 1997 1998 1999 2000 2001 2002 North Coast North Central Central Coast South Central Coast South Coast Figure 3-6: 1993 to 2002 Weight of Landings by Region Source: Pacific Coast Fisheries Information Network (Pacfin) US $Million 180 160 140 120 100 80 60 40 20 0 1993 to 2002 Value of Landings (US $Million) 1993 1994 1995 1996 1997 1998 1999 2000 2001 2002 North Coast North Central Central Coast South Central Coast South Coast Figure 3-7: 1993 to 2002 Value of Landings by Region Source: Pacific Coast Fisheries Information Network (Pacfin) More recent information on <strong>California</strong>’s Living <strong>Resources</strong> industry can be found in Appendix B to this report. The information reported in the body of this report reflects data from 1990 to 2000 and uses the SIC codes as the basis for classification of values, for 41
- Page 1 and 2: NOEP CALIFORNIA’S OCEAN ECONOMY R
- Page 3 and 4: NOEP Table of Contents Executive Su
- Page 5 and 6: NOEP PART IV APPENDIX .............
- Page 7 and 8: NOEP Table 6-4: 2000 Employment, Wa
- Page 9 and 10: NOEP Figure 8-4: Fishing and Boatin
- Page 11 and 12: NOEP Executive Summary California
- Page 13 and 14: NOEP Acknowledgements The State of
- Page 15 and 16: NOEP PART I BACKGROUND AND SUMMARY
- Page 17 and 18: NOEP ocean and economic activity, s
- Page 19 and 20: NOEP The use of SIC codes and geogr
- Page 21 and 22: NOEP Chapter 2 Summary of Findings
- Page 23 and 24: NOEP Table 2-2: Regional Population
- Page 25 and 26: NOEP Table 2-5: Growth Rates for Co
- Page 27 and 28: NOEP 2.4 California’s Ocean Econo
- Page 29 and 30: NOEP 2.5 California’s Ocean Econo
- Page 31 and 32: NOEP Table 2-10: California Ocean E
- Page 33 and 34: NOEP Figure 2-5 shows that the prop
- Page 35 and 36: NOEP Number of Workers 1,000,000 10
- Page 37 and 38: NOEP 2.7 Indirect and Induced Estim
- Page 39 and 40: NOEP • Construction trends in mar
- Page 41 and 42: NOEP PART II THE SECTORS OF THE CAL
- Page 43 and 44: NOEP assess: a) Landings and landed
- Page 45 and 46: NOEP Billion Pounds 12 10 8 6 4 2 0
- Page 47 and 48: NOEP Percentage 25% 20% 15% 10% 5%
- Page 49: NOEP in terms of revenue, replacing
- Page 53 and 54: NOEP Thousands of Wet Tons 200 180
- Page 55 and 56: NOEP 3.4 Conclusion Living Resource
- Page 57 and 58: NOEP Chapter 4 California Ocean Min
- Page 59 and 60: NOEP Table 4-3: California Offshore
- Page 61 and 62: NOEP Table 4-6: Coastal Counties On
- Page 63 and 64: NOEP are concentrated in less than
- Page 65 and 66: NOEP Chapter 5 California Marine Tr
- Page 67 and 68: NOEP million tons of foreign cargo
- Page 69 and 70: NOEP 120,000,000 100,000,000 80,000
- Page 71 and 72: NOEP From 1992 to 2001, total value
- Page 73 and 74: NOEP Table 5-4: Port Rankings 2001
- Page 75 and 76: NOEP 5.2 CA Water Transportation: R
- Page 77 and 78: NOEP Table 5-9: Warehousing (SIC co
- Page 79 and 80: NOEP Table 5-11: Marine Passenger T
- Page 81 and 82: NOEP Table 5-13: Search and Navigat
- Page 83 and 84: NOEP 5.2 References California Mari
- Page 85 and 86: NOEP Chapter 6 California Marine Co
- Page 87 and 88: NOEP 6.2.1 Historical Capital Expen
- Page 89 and 90: NOEP 60.0% 50.0% 40.0% 30.0% 20.0%
- Page 91 and 92: NOEP CA Share of Total U.S. Port Ca
- Page 93 and 94: NOEP 40 35 30 25 20 15 10 5 0 US Po
- Page 95 and 96: NOEP 6.2.2 Proposed Capital Expendi
- Page 97 and 98: NOEP 2,500 2,000 1,500 1,000 500 0
- Page 99 and 100: NOEP CA Share of Capital Expenditur
- Page 101 and 102:
NOEP 6.2.4 Economic Impact The foll
- Page 103 and 104:
NOEP 6.3 Beach Nourishment 39 In Ca
- Page 105 and 106:
NOEP Table 6-6: Funding for Califor
- Page 107 and 108:
NOEP Chapter 7: California Ship & B
- Page 109 and 110:
NOEP research ships for commercial
- Page 111 and 112:
NOEP 7.3 References CA Employment D
- Page 113 and 114:
NOEP Chapter 8 Coastal Tourism & Re
- Page 115 and 116:
NOEP volume and diversity, along th
- Page 117 and 118:
NOEP participated in marine recreat
- Page 119 and 120:
NOEP 8.2.2 California Beach Valuati
- Page 121 and 122:
NOEP No attempt has been made to es
- Page 123 and 124:
NOEP 8.2.3 Recreational Fishing and
- Page 125 and 126:
NOEP 14,000,000 12,000,000 10,000,0
- Page 127 and 128:
NOEP The travel industry supported
- Page 129 and 130:
NOEP 8.4 Regional Estimates of Cali
- Page 131 and 132:
NOEP Table 8-16 Cont. SIC4 Region N
- Page 133 and 134:
NOEP Table 8-17 summarizes the tota
- Page 135 and 136:
NOEP 8.5 References California Fast
- Page 137 and 138:
NOEP PART III CONCLUSION Future Dir
- Page 139 and 140:
NOEP PART IV APPENDIX Appendix A: T
- Page 141 and 142:
NOEP All ES-202 data are reported t
- Page 143 and 144:
NOEP At the same time, this data se
- Page 145 and 146:
NOEP fishing, or boating will not o
- Page 147 and 148:
NOEP Table B-1: Commercial Fisherie
- Page 149 and 150:
NOEP Appendix C: California Marine
- Page 151 and 152:
NOEP Appendix D: California Beaches
- Page 153 and 154:
NOEP Table D-1: Regional Beaches an
- Page 155 and 156:
NOEP Table D-1: Regional Beaches an
- Page 157 and 158:
NOEP Table D-2: Regional Beaches fr
- Page 159 and 160:
NOEP Table D-2: Regional Beaches fr
- Page 161 and 162:
NOEP Region County Beach Gray Whale
- Page 163 and 164:
NOEP Region County Beach San Luis O
- Page 165 and 166:
NOEP Region County Beach La Piedra