California's Ocean Economy - California Resources Agency - State ...
California's Ocean Economy - California Resources Agency - State ...
California's Ocean Economy - California Resources Agency - State ...
You also want an ePaper? Increase the reach of your titles
YUMPU automatically turns print PDFs into web optimized ePapers that Google loves.
NOEP<br />
following business and health services. 54 Beach and waterfront activities are the second most<br />
popular recreational pursuits of travelers to <strong>California</strong>. Coastal tourism plays an important<br />
role in attracting recreators to <strong>California</strong> and generating significant economic. The <strong>California</strong><br />
Travel and Tourism industry reflected the following highlights for the entire state for 2001. 55<br />
• The destination for an estimated 287 million domestic travelers and approximately 9<br />
million international travelers.<br />
• The most visited state with an 11.1% share of the domestic travel market.<br />
• Expenditures amounted to $75.4 billion, or 6% of <strong>California</strong>’s GSP. 56<br />
• Los Angeles County received the most domestic tourists in <strong>California</strong>. More than 45<br />
million person-trips took place in and through Los Angeles County.<br />
• Generated over $4.8 billion in tax revenues in 2001.<br />
8.3.1 Travel Spending Estimates<br />
The Travel and Tourism industry is a major part of <strong>California</strong>’s economy and is a primary<br />
industry in many local communities. Travel spending by domestic and international travelers<br />
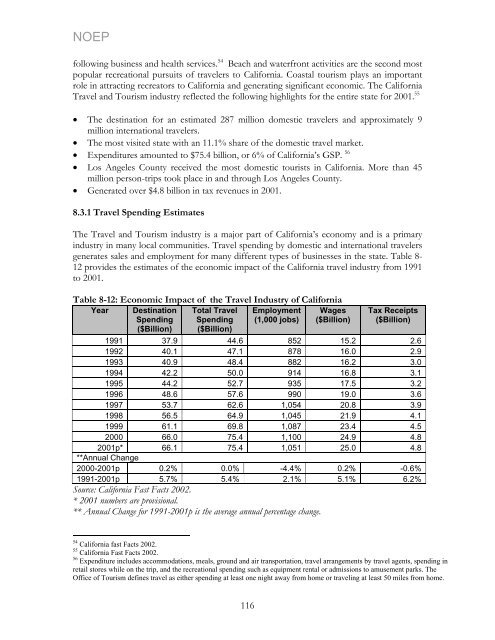
generates sales and employment for many different types of businesses in the state. Table 8-<br />
12 provides the estimates of the economic impact of the <strong>California</strong> travel industry from 1991<br />
to 2001.<br />
Table 8-12: Economic Impact of the Travel Industry of <strong>California</strong><br />
Year Destination<br />
Spending<br />
($Billion)<br />
Total Travel<br />
Spending<br />
($Billion)<br />
Employment<br />
(1,000 jobs)<br />
Wages<br />
($Billion)<br />
Tax Receipts<br />
($Billion)<br />
1991 37.9 44.6 852 15.2 2.6<br />
1992 40.1 47.1 878 16.0 2.9<br />
1993 40.9 48.4 882 16.2 3.0<br />
1994 42.2 50.0 914 16.8 3.1<br />
1995 44.2 52.7 935 17.5 3.2<br />
1996 48.6 57.6 990 19.0 3.6<br />
1997 53.7 62.6 1,054 20.8 3.9<br />
1998 56.5 64.9 1,045 21.9 4.1<br />
1999 61.1 69.8 1,087 23.4 4.5<br />
2000 66.0 75.4 1,100 24.9 4.8<br />
2001p* 66.1 75.4 1,051 25.0 4.8<br />
**Annual Change<br />
2000-2001p 0.2% 0.0% -4.4% 0.2% -0.6%<br />
1991-2001p 5.7% 5.4% 2.1% 5.1% 6.2%<br />
Source: <strong>California</strong> Fast Facts 2002.<br />
* 2001 numbers are provisional.<br />
** Annual Change for 1991-2001p is the average annual percentage change.<br />
54 <strong>California</strong> fast Facts 2002.<br />
55 <strong>California</strong> Fast Facts 2002.<br />
56 Expenditure includes accommodations, meals, ground and air transportation, travel arrangements by travel agents, spending in<br />
retail stores while on the trip, and the recreational spending such as equipment rental or admissions to amusement parks. The<br />
Office of Tourism defines travel as either spending at least one night away from home or traveling at least 50 miles from home.<br />
116


