California's Ocean Economy - California Resources Agency - State ...
California's Ocean Economy - California Resources Agency - State ...
California's Ocean Economy - California Resources Agency - State ...
You also want an ePaper? Increase the reach of your titles
YUMPU automatically turns print PDFs into web optimized ePapers that Google loves.
NOEP<br />
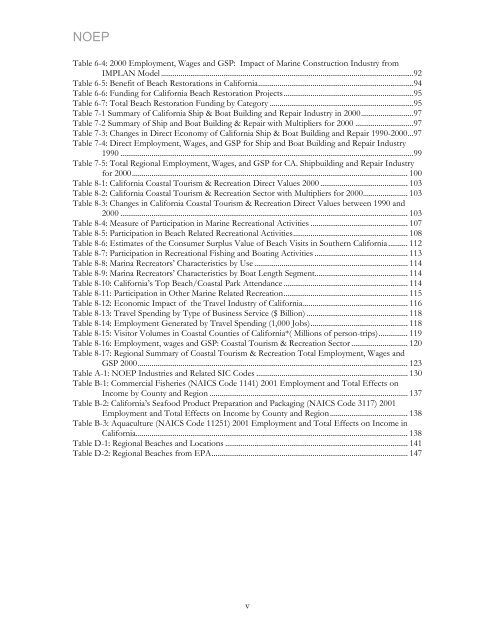
Table 6-4: 2000 Employment, Wages and GSP: Impact of Marine Construction Industry from<br />
IMPLAN Model ..................................................................................................................................92<br />
Table 6-5: Benefit of Beach Restorations in <strong>California</strong>................................................................................94<br />
Table 6-6: Funding for <strong>California</strong> Beach Restoration Projects...................................................................95<br />
Table 6-7: Total Beach Restoration Funding by Category ..........................................................................95<br />
Table 7-1 Summary of <strong>California</strong> Ship & Boat Building and Repair Industry in 2000...........................97<br />
Table 7-2 Summary of Ship and Boat Building & Repair with Multipliers for 2000 ..............................97<br />
Table 7-3: Changes in Direct <strong>Economy</strong> of <strong>California</strong> Ship & Boat Building and Repair 1990-2000...97<br />
Table 7-4: Direct Employment, Wages, and GSP for Ship and Boat Building and Repair Industry<br />
1990 .......................................................................................................................................................99<br />
Table 7-5: Total Regional Employment, Wages, and GSP for CA. Shipbuilding and Repair Industry<br />
for 2000.............................................................................................................................................. 100<br />
Table 8-1: <strong>California</strong> Coastal Tourism & Recreation Direct Values 2000 ............................................. 103<br />
Table 8-2: <strong>California</strong> Coastal Tourism & Recreation Sector with Multipliers for 2000....................... 103<br />
Table 8-3: Changes in <strong>California</strong> Coastal Tourism & Recreation Direct Values between 1990 and<br />
2000 .................................................................................................................................................... 103<br />
Table 8-4: Measure of Participation in Marine Recreational Activities .................................................. 107<br />
Table 8-5: Participation in Beach Related Recreational Activities........................................................... 108<br />
Table 8-6: Estimates of the Consumer Surplus Value of Beach Visits in Southern <strong>California</strong> .......... 112<br />
Table 8-7: Participation in Recreational Fishing and Boating Activities ................................................ 113<br />
Table 8-8: Marina Recreators’ Characteristics by Use ............................................................................... 114<br />
Table 8-9: Marina Recreators’ Characteristics by Boat Length Segment................................................ 114<br />
Table 8-10: <strong>California</strong>’s Top Beach/Coastal Park Attendance................................................................ 114<br />
Table 8-11: Participation in Other Marine Related Recreation................................................................ 115<br />
Table 8-12: Economic Impact of the Travel Industry of <strong>California</strong>...................................................... 116<br />
Table 8-13: Travel Spending by Type of Business Service ($ Billion) .................................................... 118<br />
Table 8-14: Employment Generated by Travel Spending (1,000 Jobs).................................................. 118<br />
Table 8-15: Visitor Volumes in Coastal Counties of <strong>California</strong>*( Millions of person-trips)............... 119<br />
Table 8-16: Employment, wages and GSP: Coastal Tourism & Recreation Sector ............................. 120<br />
Table 8-17: Regional Summary of Coastal Tourism & Recreation Total Employment, Wages and<br />
GSP 2000........................................................................................................................................... 123<br />
Table A-1: NOEP Industries and Related SIC Codes .............................................................................. 130<br />
Table B-1: Commercial Fisheries (NAICS Code 1141) 2001 Employment and Total Effects on<br />
Income by County and Region ...................................................................................................... 137<br />
Table B-2: <strong>California</strong>’s Seafood Product Preparation and Packaging (NAICS Code 3117) 2001<br />
Employment and Total Effects on Income by County and Region........................................ 138<br />
Table B-3: Aquaculture (NAICS Code 11251) 2001 Employment and Total Effects on Income in<br />
<strong>California</strong>............................................................................................................................................ 138<br />
Table D-1: Regional Beaches and Locations .............................................................................................. 141<br />
Table D-2: Regional Beaches from EPA..................................................................................................... 147<br />
v


