Eurobodalla Integrated Water Cycle Management Strategy
Eurobodalla Integrated Water Cycle Management Strategy
Eurobodalla Integrated Water Cycle Management Strategy

Create successful ePaper yourself
Turn your PDF publications into a flip-book with our unique Google optimized e-Paper software.
44<br />
<strong>Eurobodalla</strong> <strong>Integrated</strong> <strong>Water</strong> <strong>Cycle</strong> <strong>Management</strong> <strong>Strategy</strong><br />
6.4.1 Urban <strong>Water</strong> Use and Discharge – Past and Present<br />
Urban <strong>Water</strong> Use<br />
The current average water consumption of <strong>Eurobodalla</strong>’s urban population is about<br />
5 300 ML/a. The majority of this water is disinfected with chlorine and is delivered through<br />
Council’s regional water supply scheme. The water needs of the residents at Nelligen,<br />
South Durras and Congo are met privately by roof rainwater and backyard bore water.<br />
During periods of drought and prolonged low rainfall periods, the individual residents buy<br />
their water from the regional scheme. <strong>Water</strong> service issues relating to each town and<br />
village are discussed in more detail in part C.<br />
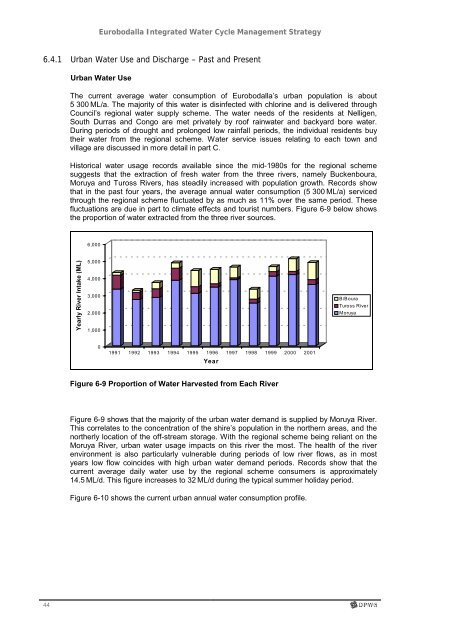
Historical water usage records available since the mid-1980s for the regional scheme<br />
suggests that the extraction of fresh water from the three rivers, namely Buckenboura,<br />
Moruya and Tuross Rivers, has steadily increased with population growth. Records show<br />
that in the past four years, the average annual water consumption (5 300 ML/a) serviced<br />
through the regional scheme fluctuated by as much as 11% over the same period. These<br />
fluctuations are due in part to climate effects and tourist numbers. Figure 6-9 below shows<br />
the proportion of water extracted from the three river sources.<br />
Yearly River Intake (ML)<br />
6,000<br />
5,000<br />
4,000<br />
3,000<br />
2,000<br />
1,000<br />
0<br />
1991 1992 1993 1994 1995 1996 1997 1998 1999 2000 2001<br />
Year<br />
Figure 6-9 Proportion of <strong>Water</strong> Harvested from Each River<br />
B/Boura<br />
Tuross River<br />
Moruya<br />
Figure 6-9 shows that the majority of the urban water demand is supplied by Moruya River.<br />
This correlates to the concentration of the shire’s population in the northern areas, and the<br />
northerly location of the off-stream storage. With the regional scheme being reliant on the<br />
Moruya River, urban water usage impacts on this river the most. The health of the river<br />
environment is also particularly vulnerable during periods of low river flows, as in most<br />
years low flow coincides with high urban water demand periods. Records show that the<br />
current average daily water use by the regional scheme consumers is approximately<br />
14.5 ML/d. This figure increases to 32 ML/d during the typical summer holiday period.<br />
Figure 6-10 shows the current urban annual water consumption profile.