Eurobodalla Integrated Water Cycle Management Strategy
Eurobodalla Integrated Water Cycle Management Strategy
Eurobodalla Integrated Water Cycle Management Strategy

You also want an ePaper? Increase the reach of your titles
YUMPU automatically turns print PDFs into web optimized ePapers that Google loves.
50<br />
<strong>Eurobodalla</strong> <strong>Integrated</strong> <strong>Water</strong> <strong>Cycle</strong> <strong>Management</strong> <strong>Strategy</strong><br />
Figure 6-14 shows that the northern, southern and central areas are all expected to<br />
experience growing urban water demands, with the northern area likely to be the greatest<br />
contributor to the regional scheme’s demand increases. Similarly, Figure 6-15 shows that<br />
although all regions are expected to experience growing daily water demands, it is the<br />
northern area that is anticipated to experience the greatest rate of increase.<br />
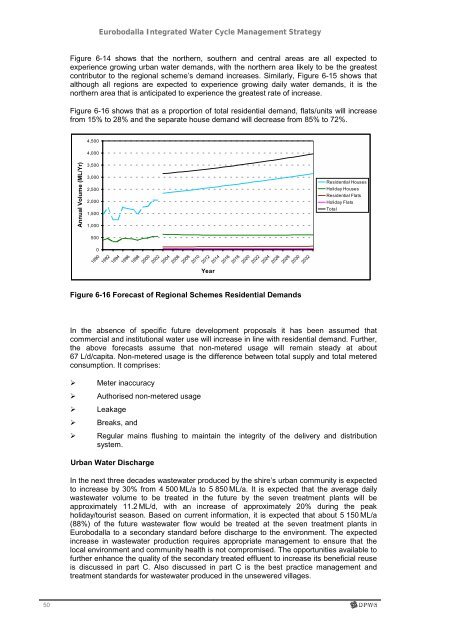
Figure 6-16 shows that as a proportion of total residential demand, flats/units will increase<br />
from 15% to 28% and the separate house demand will decrease from 85% to 72%.<br />
Annual Volume (ML/Yr)<br />
4,500<br />
4,000<br />
3,500<br />
3,000<br />
2,500<br />
2,000<br />
1,500<br />
1,000<br />
500<br />
0<br />
1990<br />
1992<br />
1994<br />
1996<br />
1998<br />
2000<br />
2002<br />
2004<br />
2006<br />
2008<br />
2010<br />
2012<br />
Year<br />
2014<br />
2016<br />
2018<br />
2020<br />
2022<br />
2024<br />
2026<br />
2028<br />
2030<br />
2032<br />
Figure 6-16 Forecast of Regional Schemes Residential Demands<br />
Residential Houses<br />
Holiday Houses<br />
Residential Flats<br />
Holiday Flats<br />
Total<br />
In the absence of specific future development proposals it has been assumed that<br />
commercial and institutional water use will increase in line with residential demand. Further,<br />
the above forecasts assume that non-metered usage will remain steady at about<br />
67 L/d/capita. Non-metered usage is the difference between total supply and total metered<br />
consumption. It comprises:<br />
Meter inaccuracy<br />
Authorised non-metered usage<br />
Leakage<br />
Breaks, and<br />
Regular mains flushing to maintain the integrity of the delivery and distribution<br />
system.<br />
Urban <strong>Water</strong> Discharge<br />
In the next three decades wastewater produced by the shire’s urban community is expected<br />
to increase by 30% from 4 500 ML/a to 5 850 ML/a. It is expected that the average daily<br />
wastewater volume to be treated in the future by the seven treatment plants will be<br />
approximately 11.2 ML/d, with an increase of approximately 20% during the peak<br />
holiday/tourist season. Based on current information, it is expected that about 5 150 ML/a<br />
(88%) of the future wastewater flow would be treated at the seven treatment plants in<br />
<strong>Eurobodalla</strong> to a secondary standard before discharge to the environment. The expected<br />
increase in wastewater production requires appropriate management to ensure that the<br />
local environment and community health is not compromised. The opportunities available to<br />
further enhance the quality of the secondary treated effluent to increase its beneficial reuse<br />
is discussed in part C. Also discussed in part C is the best practice management and<br />
treatment standards for wastewater produced in the unsewered villages.