- Page 2 and 3:
Essentials of Computational Chemist
- Page 4 and 5:
Essentials of Computational Chemist
- Page 6 and 7:
For Katherine
- Page 8 and 9:
viii CONTENTS 2.5 Menagerie of Mode
- Page 10 and 11:
x CONTENTS 7 Including Electron Cor
- Page 12 and 13:
xii CONTENTS 11.4 Strengths and Wea
- Page 14 and 15:
Preface to the First Edition Comput
- Page 16 and 17:
PREFACE TO THE FIRST EDITION xvii d
- Page 18 and 19:
xx PREFACE TO THE SECOND EDITION to
- Page 20 and 21:
Known Typographical and Other Error
- Page 22 and 23:
1 What are Theory, Computation, and
- Page 24 and 25:
Activation free energy (kcal mol
- Page 26 and 27:
1.3 COMPUTABLE QUANTITIES 5 etc.) f
- Page 28 and 29:
a a r 1 1.3 COMPUTABLE QUANTITIES 7
- Page 30 and 31:
1.3 COMPUTABLE QUANTITIES 9 path is
- Page 32 and 33:
1.4 COST AND EFFICIENCY 11 this is
- Page 34 and 35:
1.4 COST AND EFFICIENCY 13 kinds of
- Page 36 and 37:
Physical quantity (unit name) BIBLI
- Page 38 and 39:
2 Molecular Mechanics 2.1 History a
- Page 40 and 41:
2.2 POTENTIAL ENERGY FUNCTIONAL FOR
- Page 42 and 43:
2.2 POTENTIAL ENERGY FUNCTIONAL FOR
- Page 44 and 45:
2.2 POTENTIAL ENERGY FUNCTIONAL FOR
- Page 46 and 47:
2.2 POTENTIAL ENERGY FUNCTIONAL FOR
- Page 48 and 49:
2.2 POTENTIAL ENERGY FUNCTIONAL FOR
- Page 50 and 51:
2.2 POTENTIAL ENERGY FUNCTIONAL FOR
- Page 52 and 53:
2.2 POTENTIAL ENERGY FUNCTIONAL FOR
- Page 54 and 55:
2.2 POTENTIAL ENERGY FUNCTIONAL FOR
- Page 56 and 57:
2.2 POTENTIAL ENERGY FUNCTIONAL FOR
- Page 58 and 59: 2.2 POTENTIAL ENERGY FUNCTIONAL FOR
- Page 60 and 61: 2.3 FORCE-FIELD ENERGIES AND THERMO
- Page 62 and 63: Heat of formation A E nb (A) 2.4 GE
- Page 64 and 65: gradient vector, g, which is define
- Page 66 and 67: Eq. (2.38) as 2.4 GEOMETRY OPTIMIZA
- Page 68 and 69: 2.4 GEOMETRY OPTIMIZATION 47 that t
- Page 70 and 71: 2.4 GEOMETRY OPTIMIZATION 49 is opp
- Page 72 and 73: Table 2.1 Force fields Name (if any
- Page 74 and 75: 12 Davies, E. K. and Murrall, N. W.
- Page 76 and 77: 5 (MM2(85), MM2(91), Chem-3D) Compr
- Page 78 and 79: 2.5 MENAGERIE OF MODERN FORCE FIELD
- Page 80 and 81: 2.5 MENAGERIE OF MODERN FORCE FIELD
- Page 82 and 83: 2.5 MENAGERIE OF MODERN FORCE FIELD
- Page 84 and 85: 2.6 FORCE FIELDS AND DOCKING 63 Fig
- Page 86 and 87: 2.7 CASE STUDY: (2R ∗ ,4S ∗ )-1
- Page 88 and 89: REFERENCES 67 Cramer, C. J. 1994.
- Page 90 and 91: 3 Simulations of Molecular Ensemble
- Page 92 and 93: 3.2 PHASE SPACE AND TRAJECTORIES 71
- Page 94 and 95: m −b r eq −b 3.3 MOLECULAR DYNA
- Page 96 and 97: and 3.3 MOLECULAR DYNAMICS 75 p(t +
- Page 98 and 99: 3.3 MOLECULAR DYNAMICS 77 step mean
- Page 100 and 101: 3.3 MOLECULAR DYNAMICS 79 of course
- Page 102 and 103: 3.4 MONTE CARLO 81 One way to reduc
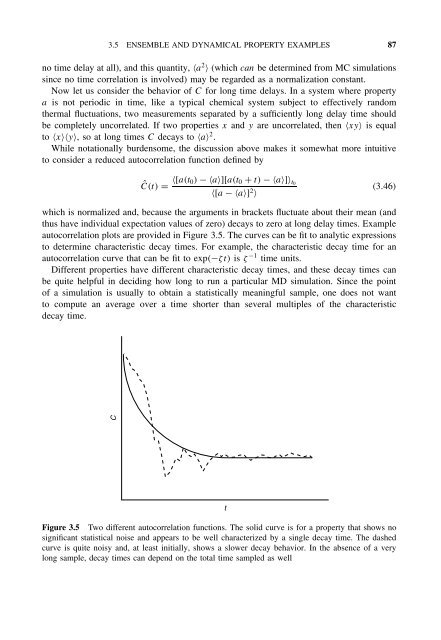
- Page 104 and 105: 3.5 ENSEMBLE AND DYNAMICAL PROPERTY
- Page 106 and 107: 3.5 ENSEMBLE AND DYNAMICAL PROPERTY
- Page 110 and 111: 3.6 KEY DETAILS IN FORMALISM 89 Fig
- Page 112 and 113: 3.6 KEY DETAILS IN FORMALISM 91 alc
- Page 114 and 115: 3.6 KEY DETAILS IN FORMALISM 93 mor
- Page 116 and 117: 3.6 KEY DETAILS IN FORMALISM 95 der
- Page 118 and 119: 3.6 KEY DETAILS IN FORMALISM 97 to
- Page 120 and 121: 3.8 CASE STUDY: SILICA SODALITE 99
- Page 122 and 123: BIBLIOGRAPHY AND SUGGESTED ADDITION
- Page 124 and 125: REFERENCES 103 Jaqaman, K. and Orto
- Page 126 and 127: 106 4 FOUNDATIONS OF MOLECULAR ORBI
- Page 128 and 129: 108 4 FOUNDATIONS OF MOLECULAR ORBI
- Page 130 and 131: 110 4 FOUNDATIONS OF MOLECULAR ORBI
- Page 132 and 133: 112 4 FOUNDATIONS OF MOLECULAR ORBI
- Page 134 and 135: 114 4 FOUNDATIONS OF MOLECULAR ORBI
- Page 136 and 137: 116 4 FOUNDATIONS OF MOLECULAR ORBI
- Page 138 and 139: 118 4 FOUNDATIONS OF MOLECULAR ORBI
- Page 140 and 141: 120 4 FOUNDATIONS OF MOLECULAR ORBI
- Page 142 and 143: 122 4 FOUNDATIONS OF MOLECULAR ORBI
- Page 144 and 145: 124 4 FOUNDATIONS OF MOLECULAR ORBI
- Page 146 and 147: 126 4 FOUNDATIONS OF MOLECULAR ORBI
- Page 148 and 149: 128 4 FOUNDATIONS OF MOLECULAR ORBI
- Page 150 and 151: 130 4 FOUNDATIONS OF MOLECULAR ORBI
- Page 152 and 153: 132 5 SEMIEMPIRICAL IMPLEMENTATIONS
- Page 154 and 155: 134 5 SEMIEMPIRICAL IMPLEMENTATIONS
- Page 156 and 157: 136 5 SEMIEMPIRICAL IMPLEMENTATIONS
- Page 158 and 159:
138 5 SEMIEMPIRICAL IMPLEMENTATIONS
- Page 160 and 161:
140 5 SEMIEMPIRICAL IMPLEMENTATIONS
- Page 162 and 163:
142 5 SEMIEMPIRICAL IMPLEMENTATIONS
- Page 164 and 165:
144 5 SEMIEMPIRICAL IMPLEMENTATIONS
- Page 166 and 167:
146 5 SEMIEMPIRICAL IMPLEMENTATIONS
- Page 168 and 169:
148 5 SEMIEMPIRICAL IMPLEMENTATIONS
- Page 170 and 171:
150 5 SEMIEMPIRICAL IMPLEMENTATIONS
- Page 172 and 173:
152 5 SEMIEMPIRICAL IMPLEMENTATIONS
- Page 174 and 175:
154 5 SEMIEMPIRICAL IMPLEMENTATIONS
- Page 176 and 177:
156 5 SEMIEMPIRICAL IMPLEMENTATIONS
- Page 178 and 179:
158 5 SEMIEMPIRICAL IMPLEMENTATIONS
- Page 180 and 181:
160 5 SEMIEMPIRICAL IMPLEMENTATIONS
- Page 182 and 183:
162 5 SEMIEMPIRICAL IMPLEMENTATIONS
- Page 184 and 185:
164 5 SEMIEMPIRICAL IMPLEMENTATIONS
- Page 186 and 187:
166 6 AB INITIO HARTREE-FOCK MO THE
- Page 188 and 189:
168 6 AB INITIO HARTREE-FOCK MO THE
- Page 190 and 191:
170 6 AB INITIO HARTREE-FOCK MO THE
- Page 192 and 193:
172 6 AB INITIO HARTREE-FOCK MO THE
- Page 194 and 195:
174 6 AB INITIO HARTREE-FOCK MO THE
- Page 196 and 197:
176 6 AB INITIO HARTREE-FOCK MO THE
- Page 198 and 199:
178 6 AB INITIO HARTREE-FOCK MO THE
- Page 200 and 201:
180 6 AB INITIO HARTREE-FOCK MO THE
- Page 202 and 203:
182 6 AB INITIO HARTREE-FOCK MO THE
- Page 204 and 205:
184 6 AB INITIO HARTREE-FOCK MO THE
- Page 206 and 207:
186 6 AB INITIO HARTREE-FOCK MO THE
- Page 208 and 209:
188 6 AB INITIO HARTREE-FOCK MO THE
- Page 210 and 211:
190 6 AB INITIO HARTREE-FOCK MO THE
- Page 212 and 213:
192 6 AB INITIO HARTREE-FOCK MO THE
- Page 214 and 215:
194 6 AB INITIO HARTREE-FOCK MO THE
- Page 216 and 217:
196 6 AB INITIO HARTREE-FOCK MO THE
- Page 218 and 219:
198 6 AB INITIO HARTREE-FOCK MO THE
- Page 220 and 221:
200 6 AB INITIO HARTREE-FOCK MO THE
- Page 222 and 223:
202 6 AB INITIO HARTREE-FOCK MO THE
- Page 224 and 225:
204 7 INCLUDING ELECTRON CORRELATIO
- Page 226 and 227:
206 7 INCLUDING ELECTRON CORRELATIO
- Page 228 and 229:
208 7 INCLUDING ELECTRON CORRELATIO
- Page 230 and 231:
210 7 INCLUDING ELECTRON CORRELATIO
- Page 232 and 233:
212 7 INCLUDING ELECTRON CORRELATIO
- Page 234 and 235:
214 7 INCLUDING ELECTRON CORRELATIO
- Page 236 and 237:
216 7 INCLUDING ELECTRON CORRELATIO
- Page 238 and 239:
218 7 INCLUDING ELECTRON CORRELATIO
- Page 240 and 241:
220 7 INCLUDING ELECTRON CORRELATIO
- Page 242 and 243:
222 7 INCLUDING ELECTRON CORRELATIO
- Page 244 and 245:
224 7 INCLUDING ELECTRON CORRELATIO
- Page 246 and 247:
226 7 INCLUDING ELECTRON CORRELATIO
- Page 248 and 249:
228 7 INCLUDING ELECTRON CORRELATIO
- Page 250 and 251:
230 7 INCLUDING ELECTRON CORRELATIO
- Page 252 and 253:
232 7 INCLUDING ELECTRON CORRELATIO
- Page 254 and 255:
234 7 INCLUDING ELECTRON CORRELATIO
- Page 256 and 257:
236 7 INCLUDING ELECTRON CORRELATIO
- Page 258 and 259:
238 7 INCLUDING ELECTRON CORRELATIO
- Page 260 and 261:
240 7 INCLUDING ELECTRON CORRELATIO
- Page 262 and 263:
242 7 INCLUDING ELECTRON CORRELATIO
- Page 264 and 265:
244 7 INCLUDING ELECTRON CORRELATIO
- Page 266 and 267:
246 7 INCLUDING ELECTRON CORRELATIO
- Page 268 and 269:
248 7 INCLUDING ELECTRON CORRELATIO
- Page 270 and 271:
250 8 DENSITY FUNCTIONAL THEORY num
- Page 272 and 273:
252 8 DENSITY FUNCTIONAL THEORY for
- Page 274 and 275:
254 8 DENSITY FUNCTIONAL THEORY fun
- Page 276 and 277:
256 8 DENSITY FUNCTIONAL THEORY Not
- Page 278 and 279:
258 8 DENSITY FUNCTIONAL THEORY emp
- Page 280 and 281:
260 8 DENSITY FUNCTIONAL THEORY whe
- Page 282 and 283:
262 8 DENSITY FUNCTIONAL THEORY whe
- Page 284 and 285:
264 8 DENSITY FUNCTIONAL THEORY [As
- Page 286 and 287:
266 8 DENSITY FUNCTIONAL THEORY som
- Page 288 and 289:
268 8 DENSITY FUNCTIONAL THEORY for
- Page 290 and 291:
270 8 DENSITY FUNCTIONAL THEORY whe
- Page 292 and 293:
272 8 DENSITY FUNCTIONAL THEORY Ano
- Page 294 and 295:
274 8 DENSITY FUNCTIONAL THEORY Eve
- Page 296 and 297:
276 8 DENSITY FUNCTIONAL THEORY val
- Page 298 and 299:
278 8 DENSITY FUNCTIONAL THEORY acc
- Page 300 and 301:
280 8 DENSITY FUNCTIONAL THEORY als
- Page 302 and 303:
282 8 DENSITY FUNCTIONAL THEORY Tab
- Page 304 and 305:
284 8 DENSITY FUNCTIONAL THEORY Tab
- Page 306 and 307:
286 8 DENSITY FUNCTIONAL THEORY Tab
- Page 308 and 309:
288 8 DENSITY FUNCTIONAL THEORY Tab
- Page 310 and 311:
290 8 DENSITY FUNCTIONAL THEORY Tab
- Page 312 and 313:
292 8 DENSITY FUNCTIONAL THEORY Tab
- Page 314 and 315:
294 8 DENSITY FUNCTIONAL THEORY con
- Page 316 and 317:
296 8 DENSITY FUNCTIONAL THEORY Tab
- Page 318 and 319:
298 8 DENSITY FUNCTIONAL THEORY Tab
- Page 320 and 321:
300 8 DENSITY FUNCTIONAL THEORY dou
- Page 322 and 323:
302 8 DENSITY FUNCTIONAL THEORY Cho
- Page 324 and 325:
9 Charge Distribution and Spectrosc
- Page 326 and 327:
9.1 PROPERTIES RELATED TO CHARGE DI
- Page 328 and 329:
9.1 PROPERTIES RELATED TO CHARGE DI
- Page 330 and 331:
9.1 PROPERTIES RELATED TO CHARGE DI
- Page 332 and 333:
9.1 PROPERTIES RELATED TO CHARGE DI
- Page 334 and 335:
9.1 PROPERTIES RELATED TO CHARGE DI
- Page 336 and 337:
9.1 PROPERTIES RELATED TO CHARGE DI
- Page 338 and 339:
9.1 PROPERTIES RELATED TO CHARGE DI
- Page 340 and 341:
9.1 PROPERTIES RELATED TO CHARGE DI
- Page 342 and 343:
9.1 PROPERTIES RELATED TO CHARGE DI
- Page 344 and 345:
9.1 PROPERTIES RELATED TO CHARGE DI
- Page 346 and 347:
9.1 PROPERTIES RELATED TO CHARGE DI
- Page 348 and 349:
H H P O H H H F Cl Cl P P F H F F P
- Page 350 and 351:
9.3 SPECTROSCOPY OF NUCLEAR MOTION
- Page 352 and 353:
9.3 SPECTROSCOPY OF NUCLEAR MOTION
- Page 354 and 355:
Energy hn 0→1 9.3 SPECTROSCOPY OF
- Page 356 and 357:
9.3 SPECTROSCOPY OF NUCLEAR MOTION
- Page 358 and 359:
9.3 SPECTROSCOPY OF NUCLEAR MOTION
- Page 360 and 361:
9.3 SPECTROSCOPY OF NUCLEAR MOTION
- Page 362 and 363:
9.3 SPECTROSCOPY OF NUCLEAR MOTION
- Page 364 and 365:
9.4 NMR SPECTRAL PROPERTIES 345 The
- Page 366 and 367:
9.4 NMR SPECTRAL PROPERTIES 347 Tab
- Page 368 and 369:
9.5 CASE STUDY: MATRIX ISOLATION OF
- Page 370 and 371:
REFERENCES 351 The use of computed
- Page 372 and 373:
REFERENCES 353 Rablen, P. R., Pearl
- Page 374 and 375:
356 10 THERMODYNAMIC PROPERTIES of
- Page 376 and 377:
358 10 THERMODYNAMIC PROPERTIES whe
- Page 378 and 379:
360 10 THERMODYNAMIC PROPERTIES tha
- Page 380 and 381:
362 10 THERMODYNAMIC PROPERTIES (Th
- Page 382 and 383:
364 10 THERMODYNAMIC PROPERTIES the
- Page 384 and 385:
366 10 THERMODYNAMIC PROPERTIES the
- Page 386 and 387:
368 10 THERMODYNAMIC PROPERTIES Ene
- Page 388 and 389:
370 10 THERMODYNAMIC PROPERTIES the
- Page 390 and 391:
372 10 THERMODYNAMIC PROPERTIES 10.
- Page 392 and 393:
374 10 THERMODYNAMIC PROPERTIES gen
- Page 394 and 395:
376 10 THERMODYNAMIC PROPERTIES the
- Page 396 and 397:
378 10 THERMODYNAMIC PROPERTIES whe
- Page 398 and 399:
380 10 THERMODYNAMIC PROPERTIES whe
- Page 400 and 401:
382 10 THERMODYNAMIC PROPERTIES Tab
- Page 402 and 403:
384 10 THERMODYNAMIC PROPERTIES Clo
- Page 404 and 405:
386 11 IMPLICIT MODELS FOR CONDENSE
- Page 406 and 407:
388 11 IMPLICIT MODELS FOR CONDENSE
- Page 408 and 409:
390 11 IMPLICIT MODELS FOR CONDENSE
- Page 410 and 411:
392 11 IMPLICIT MODELS FOR CONDENSE
- Page 412 and 413:
394 11 IMPLICIT MODELS FOR CONDENSE
- Page 414 and 415:
396 11 IMPLICIT MODELS FOR CONDENSE
- Page 416 and 417:
398 11 IMPLICIT MODELS FOR CONDENSE
- Page 418 and 419:
400 11 IMPLICIT MODELS FOR CONDENSE
- Page 420 and 421:
402 11 IMPLICIT MODELS FOR CONDENSE
- Page 422 and 423:
404 11 IMPLICIT MODELS FOR CONDENSE
- Page 424 and 425:
406 11 IMPLICIT MODELS FOR CONDENSE
- Page 426 and 427:
408 11 IMPLICIT MODELS FOR CONDENSE
- Page 428 and 429:
410 11 IMPLICIT MODELS FOR CONDENSE
- Page 430 and 431:
412 11 IMPLICIT MODELS FOR CONDENSE
- Page 432 and 433:
414 11 IMPLICIT MODELS FOR CONDENSE
- Page 434 and 435:
416 11 IMPLICIT MODELS FOR CONDENSE
- Page 436 and 437:
418 11 IMPLICIT MODELS FOR CONDENSE
- Page 438 and 439:
420 11 IMPLICIT MODELS FOR CONDENSE
- Page 440 and 441:
422 11 IMPLICIT MODELS FOR CONDENSE
- Page 442 and 443:
424 11 IMPLICIT MODELS FOR CONDENSE
- Page 444 and 445:
426 11 IMPLICIT MODELS FOR CONDENSE
- Page 446 and 447:
12 Explicit Models for Condensed Ph
- Page 448 and 449:
12.2 COMPUTING FREE-ENERGY DIFFEREN
- Page 450 and 451:
12.2 COMPUTING FREE-ENERGY DIFFEREN
- Page 452 and 453:
∆G 12.2 COMPUTING FREE-ENERGY DIF
- Page 454 and 455:
12.2 COMPUTING FREE-ENERGY DIFFEREN
- Page 456 and 457:
12.2 COMPUTING FREE-ENERGY DIFFEREN
- Page 458 and 459:
12.2 COMPUTING FREE-ENERGY DIFFEREN
- Page 460 and 461:
12.2 COMPUTING FREE-ENERGY DIFFEREN
- Page 462 and 463:
12.4 SOLVENT MODELS 445 In some cas
- Page 464 and 465:
12.4 SOLVENT MODELS 447 increases t
- Page 466 and 467:
12.5 RELATIVE MERITS OF EXPLICIT AN
- Page 468 and 469:
12.5 RELATIVE MERITS OF EXPLICIT AN
- Page 470 and 471:
12.6 CASE STUDY: BINDING OF BIOTIN
- Page 472 and 473:
REFERENCES 455 Levy, R. M. and Gall
- Page 474 and 475:
13 Hybrid Quantal/Classical Models
- Page 476 and 477:
13.2 BOUNDARIES THROUGH SPACE 459 a
- Page 478 and 479:
13.2 BOUNDARIES THROUGH SPACE 461 i
- Page 480 and 481:
13.2 BOUNDARIES THROUGH SPACE 463 T
- Page 482 and 483:
13.2 BOUNDARIES THROUGH SPACE 465 W
- Page 484 and 485:
13.3 BOUNDARIES THROUGH BONDS 467 t
- Page 486 and 487:
13.3 BOUNDARIES THROUGH BONDS 469 o
- Page 488 and 489:
180 180 4 10 15 15 20 150 6 8 150 8
- Page 490 and 491:
13.3 BOUNDARIES THROUGH BONDS 473 O
- Page 492 and 493:
13.3.3 Frozen Orbitals 13.3 BOUNDAR
- Page 494 and 495:
Link atom LSCF GHO 13.4 EMPIRICAL V
- Page 496 and 497:
13.4 EMPIRICAL VALENCE BOND METHODS
- Page 498 and 499:
13.4 EMPIRICAL VALENCE BOND METHODS
- Page 500 and 501:
13.5 CASE STUDY: CATALYTIC MECHANIS
- Page 502 and 503:
REFERENCES 485 Gao, J., Amara, P.,
- Page 504 and 505:
14 Excited Electronic States 14.1 D
- Page 506 and 507:
14.1 DETERMINANTAL/CONFIGURATIONAL
- Page 508 and 509:
14.1 DETERMINANTAL/CONFIGURATIONAL
- Page 510 and 511:
14.2 SINGLY EXCITED STATES 493 and
- Page 512 and 513:
14.2 SINGLY EXCITED STATES 495 Tabl
- Page 514 and 515:
14.2 SINGLY EXCITED STATES 497 wher
- Page 516 and 517:
14.3 GENERAL EXCITED STATE METHODS
- Page 518 and 519:
14.3 GENERAL EXCITED STATE METHODS
- Page 520 and 521:
14.4 SUM AND PROJECTION METHODS 503
- Page 522 and 523:
14.4 SUM AND PROJECTION METHODS 505
- Page 524 and 525:
14.5 TRANSITION PROBABILITIES 507 o
- Page 526 and 527:
14.5 TRANSITION PROBABILITIES 509 I
- Page 528 and 529:
14.6 SOLVATOCHROMISM 511 overlap) l
- Page 530 and 531:
14.7 CASE STUDY: ORGANIC LIGHT EMIT
- Page 532 and 533:
BIBLIOGRAPHY AND SUGGESTED ADDITION
- Page 534 and 535:
REFERENCES 517 Kim, K., Shavitt, I,
- Page 536 and 537:
520 15 ADIABATIC REACTION DYNAMICS
- Page 538 and 539:
522 15 ADIABATIC REACTION DYNAMICS
- Page 540 and 541:
524 15 ADIABATIC REACTION DYNAMICS
- Page 542 and 543:
526 15 ADIABATIC REACTION DYNAMICS
- Page 544 and 545:
528 15 ADIABATIC REACTION DYNAMICS
- Page 546 and 547:
530 15 ADIABATIC REACTION DYNAMICS
- Page 548 and 549:
532 15 ADIABATIC REACTION DYNAMICS
- Page 550 and 551:
534 15 ADIABATIC REACTION DYNAMICS
- Page 552 and 553:
536 15 ADIABATIC REACTION DYNAMICS
- Page 554 and 555:
538 15 ADIABATIC REACTION DYNAMICS
- Page 556 and 557:
540 15 ADIABATIC REACTION DYNAMICS
- Page 558 and 559:
542 15 ADIABATIC REACTION DYNAMICS
- Page 560 and 561:
544 15 ADIABATIC REACTION DYNAMICS
- Page 562 and 563:
546 15 ADIABATIC REACTION DYNAMICS
- Page 564 and 565:
Appendix A Acronym Glossary Note: B
- Page 566 and 567:
ACRONYM GLOSSARY 551 ECP Effective
- Page 568 and 569:
ACRONYM GLOSSARY 553 mPW1S mPW1PW91
- Page 570 and 571:
ACRONYM GLOSSARY 555 SF-CISD Spin-f
- Page 572 and 573:
558 APPENDIX B H 3 C CH 3 H H H a
- Page 574 and 575:
560 APPENDIX B Linear molecule? no
- Page 576 and 577:
562 APPENDIX B Table B.5 Product ru
- Page 578 and 579:
Appendix C Spin Algebra C.1 Spin Op
- Page 580 and 581:
function we have SPIN ALGEBRA 567
- Page 582 and 583:
SPIN ALGEBRA 569 + = 1 1 ( 2 2 α(
- Page 584 and 585:
C.3 UHF Wave Functions SPIN ALGEBRA
- Page 586 and 587:
SPIN ALGEBRA 573 = 〈cs s |H |cs s
- Page 588 and 589:
Appendix D Orbital Localization D.1
- Page 590 and 591:
ORBITAL LOCALIZATION 577 〈|H |〉
- Page 592 and 593:
E rel (kcal mol −1 ) 10 8 6 4 2 0
- Page 594 and 595:
582 INDEX B3PW91, 266-267, 284, 288
- Page 596 and 597:
584 INDEX Convergence (continued) f
- Page 598 and 599:
Global minimum, 23, 46, 97, 146, 38
- Page 600 and 601:
Matrix diagonalization, (see also S
- Page 602 and 603:
primitive, 168-173 Slater-type, 134
- Page 604 and 605:
Reductive dechlorination, 422-424 R
- Page 606 and 607:
SYBYL, 58 Symmetry, 182-188, 209, 2