World in Transition: Climate Change as a Security Risk - WBGU
World in Transition: Climate Change as a Security Risk - WBGU
World in Transition: Climate Change as a Security Risk - WBGU
Create successful ePaper yourself
Turn your PDF publications into a flip-book with our unique Google optimized e-Paper software.
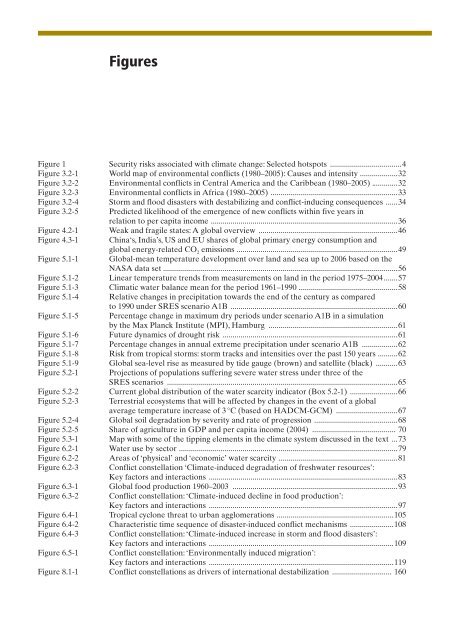
Figures<br />
Figure 1 <strong>Security</strong> risks <strong>as</strong>sociated with climate change: Selected hotspots ....................................4<br />
Figure 3.2-1 <strong>World</strong> map of environmental conflicts (1980–2005): Causes and <strong>in</strong>tensity ...................32<br />
Figure 3.2-2 Environmental conflicts <strong>in</strong> Central America and the Caribbean (1980–2005) . ............32<br />
Figure 3.2-3 Environmental conflicts <strong>in</strong> Africa (1980–2005) ................................................................33<br />
Figure 3.2-4 Storm and flood dis<strong>as</strong>ters with destabiliz<strong>in</strong>g and conflict-<strong>in</strong>duc<strong>in</strong>g consequences ......34<br />
Figure 3.2-5 Predicted likelihood of the emergence of new conflicts with<strong>in</strong> five years <strong>in</strong><br />
relation to per capita <strong>in</strong>come ..............................................................................................36<br />
Figure 4.2-1 Weak and fragile states: A global overview ......................................................................46<br />
Figure 4.3-1 Ch<strong>in</strong>a‘s, India’s, US and EU shares of global primary energy consumption and<br />
global energy-related CO 2 emissions .................................................................................49<br />
Figure 5.1-1 Global-mean temperature development over land and sea up to 2006 b<strong>as</strong>ed on the<br />
NASA data set ......................................................................................................................56<br />
Figure 5.1-2 L<strong>in</strong>ear temperature trends from me<strong>as</strong>urements on land <strong>in</strong> the period 1975–2004 .......57<br />
Figure 5.1-3 Climatic water balance mean for the period 1961–1990 . .................................................58<br />
Figure 5.1-4 Relative changes <strong>in</strong> precipitation towards the end of the century <strong>as</strong> compared<br />
to 1990 under SRES scenario A1B ....................................................................................60<br />
Figure 5.1-5 Percentage change <strong>in</strong> maximum dry periods under scenario A1B <strong>in</strong> a simulation<br />
by the Max Planck Institute (MPI), Hamburg .................................................................61<br />
Figure 5.1-6 Future dynamics of drought risk ........................................................................................61<br />
Figure 5.1-7 Percentage changes <strong>in</strong> annual extreme precipitation under scenario A1B ..................62<br />
Figure 5.1-8 <strong>Risk</strong> from tropical storms: storm tracks and <strong>in</strong>tensities over the p<strong>as</strong>t 150 years ..........62<br />
Figure 5.1-9 Global sea-level rise <strong>as</strong> me<strong>as</strong>ured by tide gauge (brown) and satellite (black) ...........63<br />
Figure 5.2-1 Projections of populations suffer<strong>in</strong>g severe water stress under three of the<br />
SRES scenarios ....................................................................................................................65<br />
Figure 5.2-2 Current global distribution of the water scarcity <strong>in</strong>dicator (Box 5.2-1) ........................66<br />
Figure 5.2-3 Terrestrial ecosystems that will be affected by changes <strong>in</strong> the event of a global<br />
average temperature <strong>in</strong>cre<strong>as</strong>e of 3 °C (b<strong>as</strong>ed on HADCM-GCM) ...............................67<br />
Figure 5.2-4 Global soil degradation by severity and rate of progression ..........................................68<br />
Figure 5.2-5 Share of agriculture <strong>in</strong> GDP and per capita <strong>in</strong>come (2004) .......................................... 70<br />
Figure 5.3-1 Map with some of the tipp<strong>in</strong>g elements <strong>in</strong> the climate system discussed <strong>in</strong> the text ...73<br />
Figure 6.2-1 Water use by sector ..............................................................................................................79<br />
Figure 6.2-2 Are<strong>as</strong> of ‘physical’ and ‘economic’ water scarcity ............................................................81<br />
Figure 6.2-3 Conflict constellation ‘<strong>Climate</strong>-<strong>in</strong>duced degradation of freshwater resources’:<br />
Key factors and <strong>in</strong>teractions ...............................................................................................83<br />
Figure 6.3-1 Global food production 1960–2003 ...................................................................................93<br />
Figure 6.3-2 Conflict constellation: ‘<strong>Climate</strong>-<strong>in</strong>duced decl<strong>in</strong>e <strong>in</strong> food production’:<br />
Key factors and <strong>in</strong>teractions ...............................................................................................97<br />
Figure 6.4-1 Tropical cyclone threat to urban agglomerations ...........................................................105<br />
Figure 6.4-2 Characteristic time sequence of dis<strong>as</strong>ter-<strong>in</strong>duced conflict mechanisms ......................108<br />
Figure 6.4-3 Conflict constellation: ‘<strong>Climate</strong>-<strong>in</strong>duced <strong>in</strong>cre<strong>as</strong>e <strong>in</strong> storm and flood dis<strong>as</strong>ters’:<br />
Key factors and <strong>in</strong>teractions .............................................................................................109<br />
Figure 6.5-1 Conflict constellation: ‘Environmentally <strong>in</strong>duced migration’:<br />
Key factors and <strong>in</strong>teractions .............................................................................................119<br />
Figure 8.1-1 Conflict constellations <strong>as</strong> drivers of <strong>in</strong>ternational destabilization .............................. 160


