World in Transition: Climate Change as a Security Risk - WBGU
World in Transition: Climate Change as a Security Risk - WBGU
World in Transition: Climate Change as a Security Risk - WBGU

You also want an ePaper? Increase the reach of your titles
YUMPU automatically turns print PDFs into web optimized ePapers that Google loves.
172<br />
8 <strong>Climate</strong> change <strong>as</strong> a driver of social destabilization and threat to <strong>in</strong>ternational security<br />
Box 8.3-1<br />
The major newly <strong>in</strong>dustrializ<strong>in</strong>g countries’<br />
possible future share of global greenhouse g<strong>as</strong><br />
emissions<br />
In 2000, Ch<strong>in</strong>a accounted for around 12 per cent of the<br />
world’s total greenhouse g<strong>as</strong> emissions. India’s share w<strong>as</strong><br />
4.5 per cent, Brazil’s 5.3 per cent, and the OECD countries’<br />
share w<strong>as</strong> 37 per cent (CAIT WRI, 2007). The emissions<br />
can be broadly categorized <strong>as</strong> CO 2 emissions from land use<br />
changes, CO 2 emissions from fossil fuels, and emissions of<br />
other greenhouse g<strong>as</strong>es (non-CO 2 emissions, e.g. methane,<br />
nitrous oxide).<br />
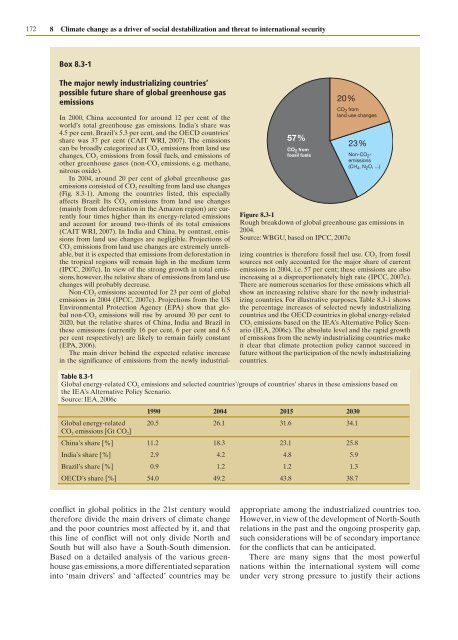
In 2004, around 20 per cent of global greenhouse g<strong>as</strong><br />
emissions consisted of CO 2 result<strong>in</strong>g from land use changes<br />
(Fig. 8.3-1). Among the countries listed, this especially<br />
affects Brazil: Its CO 2 emissions from land use changes<br />
(ma<strong>in</strong>ly from deforestation <strong>in</strong> the Amazon region) are currently<br />
four times higher than its energy-related emissions<br />
and account for around two-thirds of its total emissions<br />
(CAIT WRI, 2007). In India and Ch<strong>in</strong>a, by contr<strong>as</strong>t, emissions<br />
from land use changes are negligible. Projections of<br />
CO 2 emissions from land use changes are extremely unreliable,<br />
but it is expected that emissions from deforestation <strong>in</strong><br />
the tropical regions will rema<strong>in</strong> high <strong>in</strong> the medium term<br />
(IPCC, 2007c). In view of the strong growth <strong>in</strong> total emissions,<br />
however, the relative share of emissions from land use<br />
changes will probably decre<strong>as</strong>e.<br />
Non-CO 2 emissions accounted for 23 per cent of global<br />
emissions <strong>in</strong> 2004 (IPCC, 2007c). Projections from the US<br />
Environmental Protection Agency (EPA) show that global<br />
non-CO 2 emissions will rise by around 30 per cent to<br />
2020, but the relative shares of Ch<strong>in</strong>a, India and Brazil <strong>in</strong><br />
these emissions (currently 16 per cent, 6 per cent and 6.5<br />
per cent respectively) are likely to rema<strong>in</strong> fairly constant<br />
(EPA, 2006).<br />
The ma<strong>in</strong> driver beh<strong>in</strong>d the expected relative <strong>in</strong>cre<strong>as</strong>e<br />
<strong>in</strong> the significance of emissions from the newly <strong>in</strong>dustrial-<br />
conflict <strong>in</strong> global politics <strong>in</strong> the 21st century would<br />
therefore divide the ma<strong>in</strong> drivers of climate change<br />
and the poor countries most affected by it, and that<br />
this l<strong>in</strong>e of conflict will not only divide North and<br />
South but will also have a South-South dimension.<br />
B<strong>as</strong>ed on a detailed analysis of the various greenhouse<br />
g<strong>as</strong> emissions, a more differentiated separation<br />
<strong>in</strong>to ‘ma<strong>in</strong> drivers’ and ‘affected’ countries may be<br />
57 %<br />
CO 2 from<br />
fossil fuels<br />
20 %<br />
CO 2 from<br />
land use changes<br />
23 %<br />
Non-CO 2emissions<br />
(CH 4, N 2O, ...)<br />
Figure 8.3-1<br />
Rough breakdown of global greenhouse g<strong>as</strong> emissions <strong>in</strong><br />
2004.<br />
Source: <strong>WBGU</strong>, b<strong>as</strong>ed on IPCC, 2007c<br />
iz<strong>in</strong>g countries is therefore fossil fuel use. CO 2 from fossil<br />
sources not only accounted for the major share of current<br />
emissions <strong>in</strong> 2004, i.e. 57 per cent; these emissions are also<br />
<strong>in</strong>cre<strong>as</strong><strong>in</strong>g at a disproportionately high rate (IPCC, 2007c).<br />
There are numerous scenarios for these emissions which all<br />
show an <strong>in</strong>cre<strong>as</strong><strong>in</strong>g relative share for the newly <strong>in</strong>dustrializ<strong>in</strong>g<br />
countries. For illustrative purposes, Table 8.3-1 shows<br />
the percentage <strong>in</strong>cre<strong>as</strong>es of selected newly <strong>in</strong>dustrializ<strong>in</strong>g<br />
countries and the OECD countries <strong>in</strong> global energy-related<br />
CO 2 emissions b<strong>as</strong>ed on the IEA’s Alternative Policy Scenario<br />
(IEA, 2006c). The absolute level and the rapid growth<br />
of emissions from the newly <strong>in</strong>dustrializ<strong>in</strong>g countries make<br />
it clear that climate protection policy cannot succeed <strong>in</strong><br />
future without the participation of the newly <strong>in</strong>dustrializ<strong>in</strong>g<br />
countries.<br />
Table 8.3-1<br />
Global energy-related CO2 emissions and selected countries’/groups of countries’ shares <strong>in</strong> these emissions b<strong>as</strong>ed on<br />
the IEA’s Alternative Policy Scenario.<br />
Source: IEA, 2006c<br />
1990 2004 2015 2030<br />
Global energy-related<br />
CO2 emissions [Gt CO2] 20.5 26.1 31.6 34.1<br />
Ch<strong>in</strong>a’s share [%] 11.2 18.3 23.1 25.8<br />
India’s share [%] 2.9 4.2 4.8 5.9<br />
Brazil’s share [%] 0.9 1.2 1.2 1.3<br />
OECD’s share [%] 54.0 49.2 43.8 38.7<br />
appropriate among the <strong>in</strong>dustrialized countries too.<br />
However, <strong>in</strong> view of the development of North-South<br />
relations <strong>in</strong> the p<strong>as</strong>t and the ongo<strong>in</strong>g prosperity gap,<br />
such considerations will be of secondary importance<br />
for the conflicts that can be anticipated.<br />
There are many signs that the most powerful<br />
nations with<strong>in</strong> the <strong>in</strong>ternational system will come<br />
under very strong pressure to justify their actions