World in Transition: Climate Change as a Security Risk - WBGU
World in Transition: Climate Change as a Security Risk - WBGU
World in Transition: Climate Change as a Security Risk - WBGU

You also want an ePaper? Increase the reach of your titles
YUMPU automatically turns print PDFs into web optimized ePapers that Google loves.
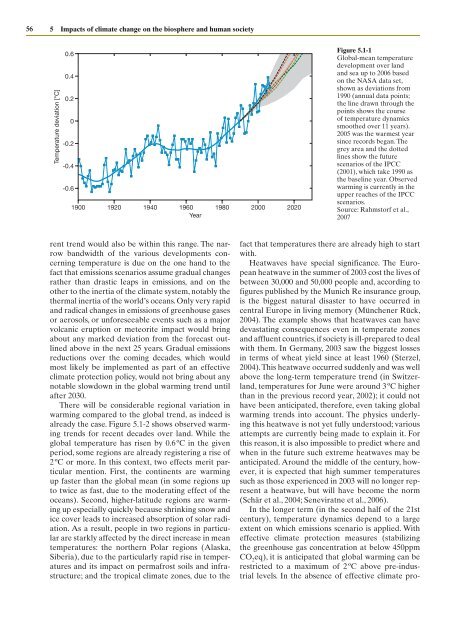
56 5 Impacts of climate change on the biosphere and human society<br />
Temperature deviation [°C]<br />
0.6<br />
0.4<br />
0.2<br />
0<br />
-0.2<br />
-0.4<br />
-0.6<br />
1900 1920 1940 1960<br />
Year<br />
1980 2000 2020<br />
rent trend would also be with<strong>in</strong> this range. The narrow<br />
bandwidth of the various developments concern<strong>in</strong>g<br />
temperature is due on the one hand to the<br />
fact that emissions scenarios <strong>as</strong>sume gradual changes<br />
rather than dr<strong>as</strong>tic leaps <strong>in</strong> emissions, and on the<br />
other to the <strong>in</strong>ertia of the climate system, notably the<br />
thermal <strong>in</strong>ertia of the world’s oceans. Only very rapid<br />
and radical changes <strong>in</strong> emissions of greenhouse g<strong>as</strong>es<br />
or aerosols, or unforeseeable events such <strong>as</strong> a major<br />
volcanic eruption or meteorite impact would br<strong>in</strong>g<br />
about any marked deviation from the forec<strong>as</strong>t outl<strong>in</strong>ed<br />
above <strong>in</strong> the next 25 years. Gradual emissions<br />
reductions over the com<strong>in</strong>g decades, which would<br />
most likely be implemented <strong>as</strong> part of an effective<br />
climate protection policy, would not br<strong>in</strong>g about any<br />
notable slowdown <strong>in</strong> the global warm<strong>in</strong>g trend until<br />
after 2030.<br />
There will be considerable regional variation <strong>in</strong><br />
warm<strong>in</strong>g compared to the global trend, <strong>as</strong> <strong>in</strong>deed is<br />
already the c<strong>as</strong>e. Figure 5.1-2 shows observed warm<strong>in</strong>g<br />
trends for recent decades over land. While the<br />
global temperature h<strong>as</strong> risen by 0.6 ºC <strong>in</strong> the given<br />
period, some regions are already register<strong>in</strong>g a rise of<br />
2 ºC or more. In this context, two effects merit particular<br />
mention. First, the cont<strong>in</strong>ents are warm<strong>in</strong>g<br />
up f<strong>as</strong>ter than the global mean (<strong>in</strong> some regions up<br />
to twice <strong>as</strong> f<strong>as</strong>t, due to the moderat<strong>in</strong>g effect of the<br />
oceans). Second, higher-latitude regions are warm<strong>in</strong>g<br />
up especially quickly because shr<strong>in</strong>k<strong>in</strong>g snow and<br />
ice cover leads to <strong>in</strong>cre<strong>as</strong>ed absorption of solar radiation.<br />
As a result, people <strong>in</strong> two regions <strong>in</strong> particular<br />
are starkly affected by the direct <strong>in</strong>cre<strong>as</strong>e <strong>in</strong> mean<br />
temperatures: the northern Polar regions ( Al<strong>as</strong>ka,<br />
Siberia), due to the particularly rapid rise <strong>in</strong> temperatures<br />
and its impact on permafrost soils and <strong>in</strong>fr<strong>as</strong>tructure;<br />
and the tropical climate zones, due to the<br />
Figure 5.1-1<br />
Global-mean temperature<br />
development over land<br />
and sea up to 2006 b<strong>as</strong>ed<br />
on the NASA data set,<br />
shown <strong>as</strong> deviations from<br />
1990 (annual data po<strong>in</strong>ts;<br />
the l<strong>in</strong>e drawn through the<br />
po<strong>in</strong>ts shows the course<br />
of temperature dynamics<br />
smoothed over 11 years).<br />
2005 w<strong>as</strong> the warmest year<br />
s<strong>in</strong>ce records began. The<br />
grey area and the dotted<br />
l<strong>in</strong>es show the future<br />
scenarios of the IPCC<br />
(2001), which take 1990 <strong>as</strong><br />
the b<strong>as</strong>el<strong>in</strong>e year. Observed<br />
warm<strong>in</strong>g is currently <strong>in</strong> the<br />
upper reaches of the IPCC<br />
scenarios.<br />
Source: Rahmstorf et al.,<br />
2007<br />
fact that temperatures there are already high to start<br />
with.<br />
Heatwaves have special significance. The European<br />
heatwave <strong>in</strong> the summer of 2003 cost the lives of<br />
between 30,000 and 50,000 people and, accord<strong>in</strong>g to<br />
figures published by the Munich Re <strong>in</strong>surance group,<br />
is the biggest natural dis<strong>as</strong>ter to have occurred <strong>in</strong><br />
central Europe <strong>in</strong> liv<strong>in</strong>g memory (Münchener Rück,<br />
2004). The example shows that heatwaves can have<br />
dev<strong>as</strong>tat<strong>in</strong>g consequences even <strong>in</strong> temperate zones<br />
and affluent countries, if society is ill-prepared to deal<br />
with them. In Germany, 2003 saw the biggest losses<br />
<strong>in</strong> terms of wheat yield s<strong>in</strong>ce at le<strong>as</strong>t 1960 (Sterzel,<br />
2004). This heatwave occurred suddenly and w<strong>as</strong> well<br />
above the long-term temperature trend (<strong>in</strong> Switzerland,<br />
temperatures for June were around 3 ºC higher<br />
than <strong>in</strong> the previous record year, 2002); it could not<br />
have been anticipated, therefore, even tak<strong>in</strong>g global<br />
warm<strong>in</strong>g trends <strong>in</strong>to account. The physics underly<strong>in</strong>g<br />
this heatwave is not yet fully understood; various<br />
attempts are currently be<strong>in</strong>g made to expla<strong>in</strong> it. For<br />
this re<strong>as</strong>on, it is also impossible to predict where and<br />
when <strong>in</strong> the future such extreme heatwaves may be<br />
anticipated. Around the middle of the century, however,<br />
it is expected that high summer temperatures<br />
such <strong>as</strong> those experienced <strong>in</strong> 2003 will no longer represent<br />
a heatwave, but will have become the norm<br />
(Schär et al., 2004; Seneviratne et al., 2006).<br />
In the longer term (<strong>in</strong> the second half of the 21st<br />
century), temperature dynamics depend to a large<br />
extent on which emissions scenario is applied. With<br />
effective climate protection me<strong>as</strong>ures (stabiliz<strong>in</strong>g<br />
the greenhouse g<strong>as</strong> concentration at below 450ppm<br />
CO 2 eq), it is anticipated that global warm<strong>in</strong>g can be<br />
restricted to a maximum of 2 ºC above pre-<strong>in</strong>dustrial<br />
levels. In the absence of effective climate pro-