Config Panel (2.40) - Guntermann und Drunck GmbH
Config Panel (2.40) - Guntermann und Drunck GmbH
Config Panel (2.40) - Guntermann und Drunck GmbH

You also want an ePaper? Increase the reach of your titles
YUMPU automatically turns print PDFs into web optimized ePapers that Google loves.
Monitoring functions<br />
Monitoring functions<br />
The current monitoring values of all devices within the KVM system can be viewed in<br />
the device-specific branches (KVM matrix systems, for example) as well as in the KVM<br />
Combinations and Critical Devices branches of the tree view.<br />
The various device information of a device can either be displayed in individual values<br />
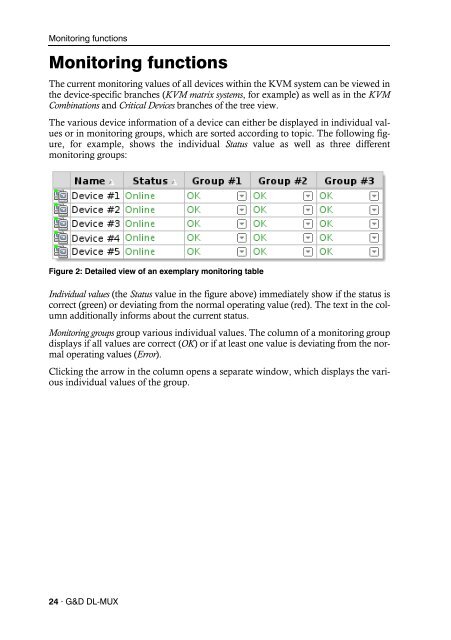
or in monitoring groups, which are sorted according to topic. The following figure,<br />
for example, shows the individual Status value as well as three different<br />
monitoring groups:<br />
Figure 2: Detailed view of an exemplary monitoring table<br />
Individual values (the Status value in the figure above) immediately show if the status is<br />
correct (green) or deviating from the normal operating value (red). The text in the column<br />
additionally informs about the current status.<br />
Monitoring groups group various individual values. The column of a monitoring group<br />
displays if all values are correct (OK) or if at least one value is deviating from the normal<br />
operating values (Error).<br />
Clicking the arrow in the column opens a separate window, which displays the various<br />
individual values of the group.<br />
24 · G&D DL-MUX