An Economic and Spatial Plan for Limerick Appendices
An Economic and Spatial Plan for Limerick Appendices
An Economic and Spatial Plan for Limerick Appendices

Create successful ePaper yourself
Turn your PDF publications into a flip-book with our unique Google optimized e-Paper software.
<strong>Limerick</strong> 2030 <strong>An</strong> <strong>Economic</strong> <strong>and</strong> <strong>Spatial</strong> <strong>Plan</strong> <strong>for</strong> <strong>Limerick</strong><br />
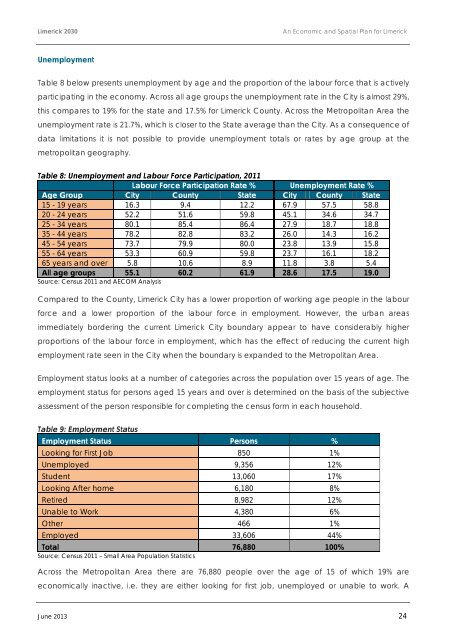
Unemployment<br />
Table 8 below presents unemployment by age <strong>and</strong> the proportion of the labour <strong>for</strong>ce that is actively<br />
participating in the economy. Across all age groups the unemployment rate in the City is almost 29%,<br />
this compares to 19% <strong>for</strong> the state <strong>and</strong> 17.5% <strong>for</strong> <strong>Limerick</strong> County. Across the Metropolitan Area the<br />
unemployment rate is 21.7%, which is closer to the State average than the City. As a consequence of<br />
data limitations it is not possible to provide unemployment totals or rates by age group at the<br />
metropolitan geography.<br />
Table 8: Unemployment <strong>and</strong> Labour Force Participation, 2011<br />
Labour Force Participation Rate % Unemployment Rate %<br />
Age Group City County State City County State<br />
15 - 19 years 16.3 9.4 12.2 67.9 57.5 58.8<br />
20 - 24 years 52.2 51.6 59.8 45.1 34.6 34.7<br />
25 - 34 years 80.1 85.4 86.4 27.9 18.7 18.8<br />
35 - 44 years 78.2 82.8 83.2 26.0 14.3 16.2<br />
45 - 54 years 73.7 79.9 80.0 23.8 13.9 15.8<br />
55 - 64 years 53.3 60.9 59.8 23.7 16.1 18.2<br />
65 years <strong>and</strong> over 5.8 10.6 8.9 11.8 3.8 5.4<br />
All age groups 55.1 60.2 61.9 28.6 17.5 19.0<br />
Source: Census 2011 <strong>and</strong> AECOM <strong>An</strong>alysis<br />
Compared to the County, <strong>Limerick</strong> City has a lower proportion of working age people in the labour<br />
<strong>for</strong>ce <strong>and</strong> a lower proportion of the labour <strong>for</strong>ce in employment. However, the urban areas<br />
immediately bordering the current <strong>Limerick</strong> City boundary appear to have considerably higher<br />
proportions of the labour <strong>for</strong>ce in employment, which has the effect of reducing the current high<br />
employment rate seen in the City when the boundary is exp<strong>and</strong>ed to the Metropolitan Area.<br />
Employment status looks at a number of categories across the population over 15 years of age. The<br />
employment status <strong>for</strong> persons aged 15 years <strong>and</strong> over is determined on the basis of the subjective<br />
assessment of the person responsible <strong>for</strong> completing the census <strong>for</strong>m in each household.<br />
Table 9: Employment Status<br />
Employment Status Persons %<br />
Looking <strong>for</strong> First Job 850 1%<br />
Unemployed 9,356 12%<br />
Student 13,060 17%<br />
Looking After home 6,180 8%<br />
Retired 8,982 12%<br />
Unable to Work 4,380 6%<br />
Other 466 1%<br />
Employed 33,606 44%<br />
Total 76,880 100%<br />
Source: Census 2011 – Small Area Population Statistics<br />
Across the Metropolitan Area there are 76,880 people over the age of 15 of which 19% are<br />
economically inactive, i.e. they are either looking <strong>for</strong> first job, unemployed or unable to work. A<br />
June 2013 24