An Economic and Spatial Plan for Limerick Appendices
An Economic and Spatial Plan for Limerick Appendices
An Economic and Spatial Plan for Limerick Appendices

Create successful ePaper yourself
Turn your PDF publications into a flip-book with our unique Google optimized e-Paper software.
<strong>Limerick</strong> 2030 <strong>An</strong> <strong>Economic</strong> <strong>and</strong> <strong>Spatial</strong> <strong>Plan</strong> <strong>for</strong> <strong>Limerick</strong><br />
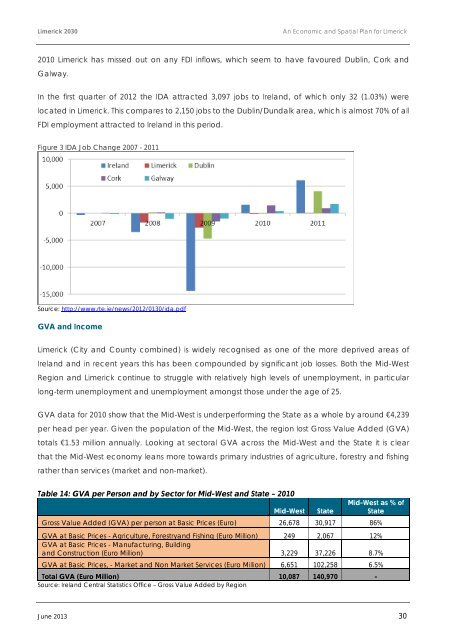
2010 <strong>Limerick</strong> has missed out on any FDI inflows, which seem to have favoured Dublin, Cork <strong>and</strong><br />
Galway.<br />
In the first quarter of 2012 the IDA attracted 3,097 jobs to Irel<strong>and</strong>, of which only 32 (1.03%) were<br />
located in <strong>Limerick</strong>. This compares to 2,150 jobs to the Dublin/Dundalk area, which is almost 70% of all<br />
FDI employment attracted to Irel<strong>and</strong> in this period.<br />
Figure 3 IDA Job Change 2007 - 2011<br />
Source: http://www.rte.ie/news/2012/0130/ida.pdf<br />
GVA <strong>and</strong> Income<br />
<strong>Limerick</strong> (City <strong>and</strong> County combined) is widely recognised as one of the more deprived areas of<br />
Irel<strong>and</strong> <strong>and</strong> in recent years this has been compounded by significant job losses. Both the Mid-West<br />
Region <strong>and</strong> <strong>Limerick</strong> continue to struggle with relatively high levels of unemployment, in particular<br />
long-term unemployment <strong>and</strong> unemployment amongst those under the age of 25.<br />
GVA data <strong>for</strong> 2010 show that the Mid-West is underper<strong>for</strong>ming the State as a whole by around €4,239<br />
per head per year. Given the population of the Mid-West, the region lost Gross Value Added (GVA)<br />
totals €1.53 million annually. Looking at sectoral GVA across the Mid-West <strong>and</strong> the State it is clear<br />
that the Mid-West economy leans more towards primary industries of agriculture, <strong>for</strong>estry <strong>and</strong> fishing<br />
rather than services (market <strong>and</strong> non-market).<br />
Table 14: GVA per Person <strong>and</strong> by Sector <strong>for</strong> Mid-West <strong>and</strong> State – 2010<br />
Mid-West State<br />
Mid-West as % of<br />
State<br />
Gross Value Added (GVA) per person at Basic Prices (Euro) 26,678 30,917 86%<br />
GVA at Basic Prices - Agriculture, Forestry<strong>and</strong> Fishing (Euro Million) 249 2,067 12%<br />
GVA at Basic Prices - Manufacturing, Building<br />
<strong>and</strong> Construction (Euro Million) 3,229 37,226 8.7%<br />
GVA at Basic Prices, - Market <strong>and</strong> Non Market Services (Euro Million) 6,651 102,258 6.5%<br />
Total GVA (Euro Million) 10,087 140,970 -<br />
Source: Irel<strong>and</strong> Central Statistics Office – Gross Value Added by Region<br />
June 2013 30