- Page 2 and 3:
Biological Control Programmes again
- Page 4 and 5:
CONTENTS Contents iii Page FOREWORD
- Page 6 and 7:
Chapter 50. Coleophora serratella (
- Page 8 and 9:
General Introduction Gcncrallntrodu
- Page 10 and 11:
PART I BIOLOGICAL CONTROL OF AGRICU
- Page 12 and 13:
4 J. S. Kelleher Table 1 to be plac
- Page 14 and 15:
Blank Page 6
- Page 16:
Blank Page 8
- Page 19 and 20:
Pest Status Background Chapter 4 Ag
- Page 22 and 23:
Blank Page 14
- Page 24 and 25:
16 R. P. Jaques and J. E. Laing vir
- Page 27:
Pest Status Background Chapter 6 Cu
- Page 30 and 31:
Blank Page 22
- Page 32 and 33:
24 J. A. Shemanchuk. H. C. Wisler a
- Page 34 and 35:
26 R. P. Jaques and J. E. Laing Tab
- Page 36 and 37:
Blank Page 28
- Page 38 and 39:
30 F. L. McEwen Literature Cited Si
- Page 40 and 41:
32 G. H. Gerber Recommendations Lit
- Page 42 and 43:
34 H. H. Cheng Parasitoids Predator
- Page 46 and 47:
Blank Page 38
- Page 49:
Pest Status Background Releases and
- Page 52 and 53:
Blank Page 44
- Page 54 and 55:
46 C. H. Craig and C. C. Loan Relea
- Page 56 and 57:
Blank Page 48
- Page 58 and 59:
50 W. J. Turnock Table 7 Table 8 Pa
- Page 61 and 62:
Table 9 Mamestra configurata Walker
- Page 63 and 64:
Literature Cited Mamestra con/igura
- Page 65 and 66:
Pest Status Background Chapter 16 M
- Page 67 and 68:
Mtmduca qllillqllemaclliata (Hawort
- Page 69 and 70:
Chapter 17 Melanoplus spp., Camnula
- Page 71 and 72:
Chapter 18 Musca domestica L., Hous
- Page 73 and 74:
Pest Status Background Chapter 19 R
- Page 75 and 76:
Recommendations Literature Cited Ou
- Page 77: Pest Status and Background Chapter
- Page 80 and 81: Blank Page 72
- Page 82 and 83: 74 H. G. Wylie, W. J. Turnock and L
- Page 85 and 86: Pest Status Background Releases and
- Page 87: Pest Status Background Chapter 23 T
- Page 92 and 93: Blank Page 84
- Page 95: Releases and Recoveries Tipilia pai
- Page 98: 90 R. J. McClanahan Releases and Re
- Page 101 and 102: PART II BIOLOGICAL CONTROL OF WEEDS
- Page 103 and 104: Success of the Programme Chapter 26
- Page 105: Table 17 Current approaches to biol
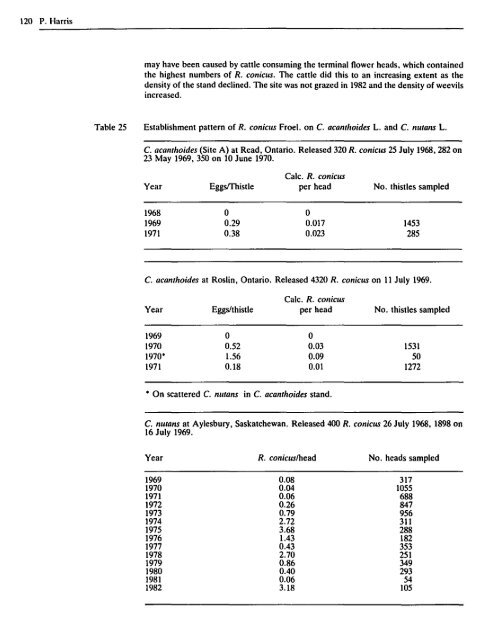
- Page 108 and 109: 100 P. Harris The number of niches
- Page 110: 102 P. Harris The Future Literature
- Page 113: Pest Status Background Chapter 27 A
- Page 117: Evaluation of Control Attempts Reco
- Page 120 and 121: Blank Page 112
- Page 123: Pest Status Chapter 30 Carduus nuta
- Page 126 and 127: 118 P. Harris Table 23 Open release
- Page 130 and 131: 122 P. Harris Table 26 C. flU/ailS
- Page 132: 124 P. Harris Reasons for the impac
- Page 135: Pest Status Chapter 31 Centaurea di
- Page 140 and 141: 132 P. Harris and J. H. Myers Metzn
- Page 142 and 143: 134 P. Harris and J. H. Myers Table
- Page 144 and 145: 136 P. Harris and J. H. Myers Ackno
- Page 146 and 147: Blank Page 138
- Page 148 and 149: 140 D. P. Peschken Ceutorhynchus lI
- Page 150 and 151: 142 D. P. Pcschken Lema cyanella (L
- Page 152: 144 D. P. Peschken Table 33 continu
- Page 155 and 156: Pest Status Background Releases and
- Page 157 and 158: Table 35 Cirs;llm I'ulg(lre (Savi)
- Page 159 and 160: The number of seeds per head vs. he
- Page 161 and 162: CiTSiu11I J'lllgaTe (Savi) Ten. , 1
- Page 163 and 164: Pest Status Background Biological C
- Page 166 and 167: Blank Page 158
- Page 168 and 169: 160 P. Harris Background desirable.
- Page 170: 162 P. Harris Table 40 Table 41 Ope
- Page 175 and 176: Table 44 Evaluation of Control Atte
- Page 178 and 179:
Blank Page 170
- Page 180 and 181:
172 P. Harris and M. Maw Releases a
- Page 182:
174 P. Harris and M. Maw Table 45 O
- Page 186 and 187:
Blank Page 178
- Page 188 and 189:
180 P. Harris Background Table 47 m
- Page 190 and 191:
182 P. Harris Recommendations Ackno
- Page 192 and 193:
184 M. G. Maw Discussion Recommenda
- Page 194 and 195:
186 M.G. Maw Background R. catharti
- Page 196:
188 M. G. Maw Recommendations Liter
- Page 199 and 200:
Pest Status Background Chapter 40 S
- Page 201 and 202:
Recommendations Acknowledgements Li
- Page 203 and 204:
Pest Status Background Chapter 41 S
- Page 205:
Releases and Recoveries HyJemya sen
- Page 209 and 210:
Sellecio jacoba('(/ 201 Myers, 1.H.
- Page 211 and 212:
Pest Status Background Chapter 42 S
- Page 213 and 214:
Pest Status Chapter 43 Sonchus arve
- Page 215 and 216:
Releases and Recoveries Table 51 Sc
- Page 217 and 218:
Sone/Ills arvensis L., 209 Skuhravd
- Page 219 and 220:
Pest Status Biological Control Stud
- Page 221 and 222:
PART III BIOLOGICAL CONTROL OF FORE
- Page 224 and 225:
216 M. A. Hulme and G. W. Green Sel
- Page 226 and 227:
218 M. A. Hulme and G. W. Green Tab
- Page 228 and 229:
220 M. A. Hulme and G. W. Green Eva
- Page 230 and 231:
222 M. A. Hulme and G. W. Green lar
- Page 232:
224 M. A. Hulme and G. W. Green abi
- Page 235 and 236:
Literature Cited Biological control
- Page 237 and 238:
Pest Status Chapter 46 Background a
- Page 239 and 240:
Tablc 55 continucd Adelges piceadRa
- Page 241 and 242:
Table 55 continued Aclelge.\· ph-e
- Page 243 and 244:
Pest Status Chapter 47 Choristoneur
- Page 245 and 246:
Literature Cited ChorislOIU'lIfCI f
- Page 247 and 248:
A. Field development of Bacillus Ih
- Page 252 and 253:
244 W. A. Smirnoffand O. N. Morris
- Page 254:
246 W. A. Smirnoff and O. N. Morris
- Page 258 and 259:
250 J. C. Cunningham and G. M. Hows
- Page 261:
Table 67 B. Viruses: Application an
- Page 267:
Literature Cited B. Viruscs: Applic
- Page 272 and 273:
264 G. G. Wilson, D. Tyrrell and T.
- Page 274 and 275:
266 G. G. Wilson. D. Tyrrrell and T
- Page 277 and 278:
CephaJogl)pta murinanae Bauer (Hyme
- Page 279 and 280:
Agria housei Shewell (Diptera: Sare
- Page 282 and 283:
274 I. W. Varty experimental biolog
- Page 284 and 285:
276 I. W. Varty Further research Li
- Page 286 and 287:
27R R. F. Shcphcrd and J. C. Cunnin
- Page 288 and 289:
Blank Page 280
- Page 290 and 291:
282 I. S. Otvos and F. W. Quednau C
- Page 292 and 293:
2M.. I. S. OtV()S and F. W. Quednau
- Page 295:
Background Releases and Recoveries
- Page 299:
Pest Status Background Chapter 51 F
- Page 305 and 306:
Ontario Gilpitlia Ill'rcylliae (Har
- Page 308 and 309:
-(I) C c::: o '';:; ::::l .c ';: 30
- Page 310 and 311:
302 L. P. Magasi and G. A. Van Sick
- Page 313 and 314:
Lymcltllria dispar (L.). 305 avian
- Page 315 and 316:
Table 80 Table 81 Ooenc)'rtus kuvsn
- Page 317:
Recommendations Literature Cited Ly
- Page 321 and 322:
Malacosoma disstria J-Hibner. 3/3 1
- Page 327 and 328:
Malam.mma disstria Hiibner, 319 Sta
- Page 329 and 330:
Pest Status Background Field Trial
- Page 331 and 332:
Pest Status Background Field Trials
- Page 333 and 334:
Aerial spray trials in Ontario in 1
- Page 335:
Table 85 Neodipriotl {ecomei (Fitch
- Page 339:
Pest Status Background Chapter 58 N
- Page 343 and 344:
Table 86 Open releases and recoveri
- Page 345:
PfeoIopbus ba9zonus (Grav.) (Hymeno
- Page 348 and 349:
340 K. J. Griffiths, J. C. Cunningh
- Page 350 and 351:
342 R. J. Finnegan and W. A. Smirno
- Page 353:
Evaluation of Control Attempts Tabl
- Page 357 and 358:
Pest Status Chapter 60 Operophtera
- Page 359 and 360:
Evaluation of Control Attempt Recom
- Page 361 and 362:
Pest Status Background Chapter 61 O
- Page 366 and 367:
Blank Page 358
- Page 368 and 369:
360 D. G. Embree. D. E. Elgee and G
- Page 370 and 371:
Blank Page 362
- Page 374 and 375:
366 J. C. Cunningham and R. F. Shep
- Page 376 and 377:
Blank Page 368
- Page 379 and 380:
Pristiphora erichsollii (Hartig). 3
- Page 381 and 382:
Releases and Recoveries Olesicampe
- Page 384 and 385:
376 W. G. H. Ives and J. A. Muldrew
- Page 386:
378 W. G. HIves and J. A. Muldrew R
- Page 389:
Pest Status Background Chapter 65 P
- Page 392:
384 F. W. Quednau Evaluation of Con
- Page 395 and 396:
Pest Status Chapter 66 Rhyacionia b
- Page 397 and 398:
Rhyaciollia blloliallll (Schiff.).
- Page 399 and 400:
c .2 5 :g Cij c Rhyacion;a buoliuna
- Page 401 and 402:
Agatbis binominata (Mues.) (Hymenop
- Page 404 and 405:
396 Appendix Raske, A.G., Newfoundl
- Page 406 and 407:
398 Index of Species Apanlt'les rub
- Page 408:
400 Index of Species Chrysoc/laris
- Page 412 and 413:
404 Index of Species lawn 85 leafy
- Page 414 and 415:
406 Index of Species pear 211 pecos
- Page 416:
408 Index of Species sibericus. Den