- Page 1 and 2: I New trends in physics teaching Vo
- Page 3 and 4: New trends in biology teaching Vol.
- Page 5 and 6: Preface The worldwide exchange of i
- Page 7 and 8: Contents Part I Energy: the Backgro
- Page 9 and 10: Part I Energy: the Background and t
- Page 11 and 12: New Trends in Physics Teaching IV W
- Page 13 and 14: New Trends in Physics Teaching IV E
- Page 15 and 16: New Trends in Physics Teaching IV A
- Page 17 and 18: I New Trends in Physics Teaching IV
- Page 19 and 20: ~ New Trends in Physics Teaching IV
- Page 21 and 22: New Trends in Physics Teaching IV T
- Page 23 and 24: New Trends in Physics Teaching IV d
- Page 25 and 26: New Trends in Physics Teaching IV A
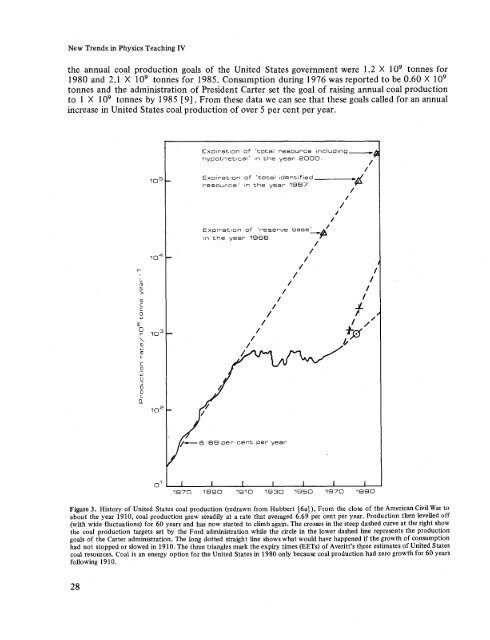
- Page 27 and 28: New Trends in Physics Teaching IV F
- Page 29 and 30: New Trends in Physics Teaching IV o
- Page 31 and 32: New Trends in Physics Teaching IV c
- Page 33: New Trends in Physics Teaching IV W
- Page 37 and 38: New Trends in Physics Teaching IV T
- Page 39 and 40: New Trends in Physics Teaching IV c
- Page 41 and 42: New Trends in Physics Teaching IV a
- Page 43 and 44: New Trends in Physics Teaching IV A
- Page 45 and 46: New Trends in Physics Teaching IV M
- Page 47 and 48: New Trends in Physics Teaching IV E
- Page 49 and 50: New Trends in Physics Teaching IV s
- Page 51 and 52: New Trends in Physics Teaching IV c
- Page 53 and 54: New Trends in Physics Teaching IV L
- Page 55 and 56: New Trends in Physics Teaching IV W
- Page 57 and 58: New Trends in Physics Teaching IV *
- Page 59 and 60: New Trends in Physics Teaching IV 1
- Page 61 and 62: New Trends in Physics Teaching IV m
- Page 63 and 64: New Trends in Physics Teaching IV R
- Page 65 and 66: New Trends in Physics Teaching IV E
- Page 67 and 68: New Trends in Physics Teaching IV T
- Page 69 and 70: New Trends in Physics Teaching IV T
- Page 71 and 72: New Trends in Physics Teaching IV I
- Page 73 and 74: New Trends in Physics Teaching IV 8
- Page 75 and 76: New Trends in Physics Teaching IV T
- Page 77 and 78: New Trends in Physics Teaching IV S
- Page 79 and 80: Energy teaching in schools Introduc
- Page 81 and 82: Japan The teaching of energy in Jap
- Page 83 and 84: Japan not teach energy concept dire
- Page 85 and 86:
Japan Amount of heat generated rela
- Page 87 and 88:
Japan ing of basic concepts, fundam
- Page 89 and 90:
Japan The teaching in this area is
- Page 91 and 92:
Methodology Japan There are several
- Page 93 and 94:
7. Measuring the amount of solar en
- Page 95 and 96:
India The teaching of energy in Ind
- Page 97 and 98:
India It is difficult to visualize
- Page 99 and 100:
1979 Solar energy air A model of a
- Page 101 and 102:
India age group 6 to 11, classes I
- Page 103 and 104:
Qatar decision to include a study o
- Page 105 and 106:
Qatar 5. 6. 7. Coal and oil are the
- Page 107 and 108:
Qatar Grade 8: Theme: ‘The use an
- Page 109 and 110:
Qatar The grade 11 physics programm
- Page 111 and 112:
USSR electric oscillations ends wit
- Page 113 and 114:
Hungary with a wide range of natura
- Page 115 and 116:
Hungary between two bodies only. Bu
- Page 117 and 118:
Hungary follows that the field itse
- Page 119 and 120:
Hungary explore rigid bodies and me
- Page 121 and 122:
REFERENCES Hungary 1. HABER-SCHAIM,
- Page 123 and 124:
Italy This approach proved interest
- Page 125 and 126:
Italy ENERGY PROBLEM: TO-DAY'S ISSU
- Page 127 and 128:
Italy equivalent or t.0.e.) are def
- Page 129 and 130:
An obvious question arises: why did
- Page 131 and 132:
knowledge of electromagnetism to th
- Page 133 and 134:
Naturally not all the particles are
- Page 135 and 136:
Senegal Reflection on current trend
- Page 137 and 138:
Senegal heat is interpreted as the
- Page 139 and 140:
The planning and developing of an i
- Page 141 and 142:
Brazil Criteria for the assessment
- Page 143 and 144:
Brazil water and ice is a system wh
- Page 145 and 146:
Brazil (heat) would still be conser
- Page 147 and 148:
Brazil Consider a further instance.
- Page 149 and 150:
Brazil An isolated system is an abs
- Page 151 and 152:
United States LEVELS AND TACTICS En
- Page 153 and 154:
United States The private sector sp
- Page 155 and 156:
United States The progression shown
- Page 157 and 158:
Packet production United States PEE
- Page 159 and 160:
United States energy situation. The
- Page 161 and 162:
United States Energy has two powerf
- Page 163 and 164:
Introductory statistical physics In
- Page 165 and 166:
Introductory statistical physics dp
- Page 167 and 168:
Introductory statistical physics on
- Page 169 and 170:
Introductory statistical physics Co
- Page 171 and 172:
Use of the Einstein solid Introduct
- Page 173 and 174:
Introductory statistical physics Ex
- Page 175 and 176:
Introductory statistical physics fo
- Page 177 and 178:
Introductory statistical physics TA
- Page 179 and 180:
~~ Exponential atmosphere Boltzmann
- Page 181 and 182:
Introductory st at ist ical physics
- Page 183 and 184:
Children’s ideas about light Chil
- Page 185 and 186:
Childrens’ ideas about light some
- Page 187 and 188:
Childrens’ ideas about light Figu
- Page 189 and 190:
Childrens’ ideas about light Figu
- Page 191 and 192:
Childrens’ ideas about light We w
- Page 193 and 194:
Childrens’ ideas about light conn
- Page 195 and 196:
Childrens’ ideas about light ‘l
- Page 197 and 198:
Colour Colour R.D. EDGE. Colour, li
- Page 199 and 200:
Colour of three primary colours nec
- Page 201 and 202:
Colour 400 500 600 700 Wavelength/
- Page 203 and 204:
Colour a, ; 0 E c \ L U Is) c - a,
- Page 205 and 206:
Colour 200 150 (I] U C ; 1 0 0 E m
- Page 207 and 208:
Colour Perceptually, if our environ
- Page 209 and 210:
Colour mentary colours as for the p
- Page 211 and 212:
Colour Difference Colour The abilit
- Page 213 and 214:
Colour Also shown on the same figur
- Page 215 and 216:
Colour screen, that taken through a
- Page 217 and 218:
Colour I 120 Noon Summer Sunlight 5
- Page 219 and 220:
y move in the direc value of the wa
- Page 221 and 222:
Surface Reflection Colour The surfa
- Page 223 and 224:
Colour index of 1.4, it is flexible
- Page 225 and 226:
Colour - Light Incident + From Iris
- Page 227 and 228:
Colour C 0 L 3 a, z E L U J Q e, J
- Page 229 and 230:
Colour illumination appears colourl
- Page 231 and 232:
Optics regained Optics regained C.A
- Page 233 and 234:
Optics regained human beings since
- Page 235 and 236:
Optics regained of energy, or the s
- Page 237 and 238:
Optics regained Consider an ordinar
- Page 239 and 240:
Optics regained Consider any two po
- Page 241 and 242:
Optics regained Figure 5 is a much
- Page 243 and 244:
Optics regained Highly coherent lig
- Page 245 and 246:
Optics regained revealing individua
- Page 247 and 248:
Optics regained the brightest sourc
- Page 249 and 250:
Optics regained is not taken, and o
- Page 251 and 252:
Optics regained image ifmis-interpr
- Page 253 and 254:
Optics regained 4. HUYGENS, C. Trai
- Page 255 and 256:
A case study of science teacher edu
- Page 257 and 258:
Teacher education: a case study 2.
- Page 259 and 260:
Teacher education: a case study alr
- Page 261 and 262:
Teacher education: a case study mor
- Page 263 and 264:
Teacher education: a case study thr
- Page 265 and 266:
Teacher education: a case study Whe
- Page 267 and 268:
Teacher education: a case study The
- Page 269 and 270:
Teacher education: a case study CON
- Page 271 and 272:
Teacher education: a dilemma where
- Page 273 and 274:
Teacher education: a dilemma ELEMEN
- Page 275 and 276:
Teacher education: a dilemma if phy
- Page 277 and 278:
Teacher education: a dilemma emerge
- Page 279 and 280:
Teacher education: a dilemma These
- Page 281 and 282:
Teacher education: a dilemma 11. CO
- Page 283 and 284:
Teacher education: solar energy cou
- Page 285 and 286:
Teacher education: solar energy cou
- Page 287 and 288:
Teacher education: solar energy nee
- Page 289 and 290:
Teacher education: solar energy the
- Page 291 and 292:
Teacher education: solar energy A P
- Page 293 and 294:
Teacher education: solar energy A W
- Page 295 and 296:
Teacher education: solar energy Sol
- Page 297 and 298:
Micro-computers as laboratory instr
- Page 299 and 300:
Microcomputers in the laboratory an
- Page 301 and 302:
A solar cooker How to construct a s
- Page 303 and 304:
A solar cooker PREPARATION AND SUBS
- Page 305 and 306:
A solar cooker c. Fill the box in (
- Page 307 and 308:
A solar cooker Let the reflector fa
- Page 309 and 310:
String and tape experiments String
- Page 311 and 312:
~ ~ String and tape experiments It
- Page 313 and 314:
String and tape experiments Since g
- Page 315 and 316:
Dropping a string of marbles String
- Page 317 and 318:
String and tape experiments Tape ar
- Page 319 and 320:
String and tape experiments + marbl
- Page 321 and 322:
String and tape experiments A I Fig
- Page 323 and 324:
String and tape experiments In an o
- Page 325 and 326:
String and tape experiments Pulse-
- Page 327 and 328:
String and tape experiments We can
- Page 329 and 330:
String and tape experiments Now, co
- Page 331 and 332:
String and tape experiments So far,
- Page 333 and 334:
String and tape experiments Current
- Page 335 and 336:
String and tape experiments For a l
- Page 337 and 338:
String and tape experiments the oth
- Page 339 and 340:
String and tape experiments CONCLUS
- Page 341 and 342:
Introduction Although school curric
- Page 343 and 344:
Science in society array of bubblin
- Page 345 and 346:
Science in society ASE’s ‘Scien
- Page 347 and 348:
ENVIRONMENTAL SCIENCE, HEALTH EDUCA
- Page 349 and 350:
I Physics in society Physics in soc
- Page 351 and 352:
Physics in society consequent long
- Page 353 and 354:
Physics in society furthermore, stu
- Page 355 and 356:
Physics in society TABLE 5. What di
- Page 357 and 358:
Physics in society APPENDIX Detaile
- Page 359 and 360:
Appropriate technology The visible
- Page 361 and 362:
Political Alternative Technology Ap
- Page 363 and 364:
Appropriate technoIogy Project work
- Page 365 and 366:
Contributors Albert A. BARTLETT, Un


