Status of medicinal and aromatic plants in - Inia
Status of medicinal and aromatic plants in - Inia
Status of medicinal and aromatic plants in - Inia

You also want an ePaper? Increase the reach of your titles
YUMPU automatically turns print PDFs into web optimized ePapers that Google loves.
PRESENTED PAPERS 111<br />
National <strong>in</strong>ventory <strong>of</strong> MAP genetic resources<br />
In 2000 the Suceava Genebank, with IPGRI's support, published the National Catalogue <strong>of</strong><br />
Plant Genetic Resources. One fascicle covers <strong>medic<strong>in</strong>al</strong> <strong>and</strong> <strong>aromatic</strong> plant collections. This<br />
catalogue <strong>in</strong>cludes only <strong>in</strong>formation on passport descriptors.<br />
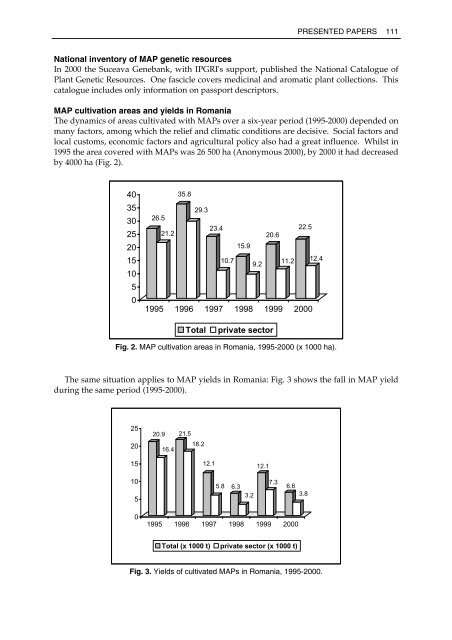
MAP cultivation areas <strong>and</strong> yields <strong>in</strong> Romania<br />
The dynamics <strong>of</strong> areas cultivated with MAPs over a six-year period (1995-2000) depended on<br />
many factors, among which the relief <strong>and</strong> climatic conditions are decisive. Social factors <strong>and</strong><br />
local customs, economic factors <strong>and</strong> agricultural policy also had a great <strong>in</strong>fluence. Whilst <strong>in</strong><br />
1995 the area covered with MAPs was 26 500 ha (Anonymous 2000), by 2000 it had decreased<br />
by 4000 ha (Fig. 2).<br />
40<br />
35<br />
30<br />
25<br />
20<br />
15<br />
10<br />
5<br />
0<br />
35.8<br />
29.3<br />
26.5<br />
23.4<br />
22.5<br />
21.2<br />
20.6<br />
15.9<br />
10.7<br />
9.2<br />
11.2 12.4<br />
1995 1996 1997 1998 1999 2000<br />
Total<br />
private sector<br />
Fig. 2. MAP cultivation areas <strong>in</strong> Romania, 1995-2000 (x 1000 ha).<br />
The same situation applies to MAP yields <strong>in</strong> Romania: Fig. 3 shows the fall <strong>in</strong> MAP yield<br />
dur<strong>in</strong>g the same period (1995-2000).<br />
25<br />
20<br />
20.9<br />
16.4<br />
21.5<br />
18.2<br />
15<br />
12.1<br />
12.1<br />
10<br />
5<br />
5.8 6.3<br />
3.2<br />
7.3<br />
6.6<br />
3.8<br />
0<br />
1995 1996 1997 1998 1999 2000<br />
Total (x 1000 t) private sector (x 1000 t)<br />
Fig. 3. Yields <strong>of</strong> cultivated MAPs <strong>in</strong> Romania, 1995-2000.