MUNICIPALITY OF LAMBTON SHORES 2012 Draft Operating Year to Date Summary as <strong>of</strong> June 30, 2012 FINAL BUDGET DRAFT YTD AVAILABLE % Used Taxation Revenue 9,004,465.73 4,186,636.59 4,817,829.14 46.50% Policing Revenue Policing 908,872.22 456,655.81 452,216.41 50.24% Community Police Group - - - Sub Total 908,872.22 456,655.81 452,216.41 50.24% Expense Policing 3,164,422.69 1,599,198.52 1,565,224.17 50.54% Community Police Group 338.13 338.13 0.00% Sub Total 3,164,760.82 1,599,198.52 1,565,562.30 50.53% Policing Total 2,255,888.60 1,142,542.71 1,113,345.89 50.65% Planning Revenue Planning and Zoning 142,844.74 68,044.87 74,799.87 47.64% Expense Planning and Zoning 174,369.90 83,334.15 91,035.75 47.79% Planning Total 31,525.16 15,289.28 16,235.88 48.50% Building & Assessment Revenue Building and Assessment Administration 217,051.76 157,591.59 59,460.17 72.61% Expense Building and Assessment Administration 281,371.87 126,181.66 155,190.21 44.85% Building Total 64,320.11 (31,409.93) 95,730.04 - Protection to Person & Property Revenue Bylaw / Parking / Prop. Stnds Enforce. 144,301.15 59,405.57 84,895.58 41.17% Animal Control 11,557.89 3,827.20 7,730.69 33.11% Weed Inspection 639.23 319.62 319.61 50.00% Crossing Guards 8,033.12 4,016.56 4,016.56 50.00% Emergency Management 711.29 355.65 355.64 50.00% Conservation Authority - Sub Total 165,242.68 67,924.60 97,318.08 41.11% Expense Bylaw / Parking / Prop. Stnds Enforce. 214,246.22 103,337.93 110,908.29 48.23% Animal Control 39,048.58 21,585.69 17,462.89 55.28% Weed Inspection 3,432.31 1,718.80 1,713.51 50.08% Crossing Guards 43,133.25 23,037.12 20,096.13 53.41% Emergency Management 3,819.22 1,382.26 2,436.96 36.19% Conservation Authority 274,049.00 143,511.00 130,538.00 52.37% Sub Total 577,728.58 294,572.80 283,155.78 50.99% Protection to Person & Property Total 412,485.90 226,648.20 185,837.70 54.95% 241 Page 1 <strong>of</strong> 4 7/04/12
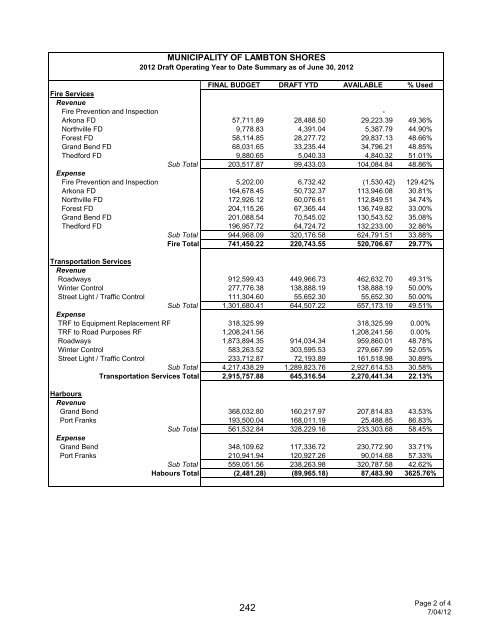
MUNICIPALITY OF LAMBTON SHORES 2012 Draft Operating Year to Date Summary as <strong>of</strong> June 30, 2012 FINAL BUDGET DRAFT YTD AVAILABLE % Used Fire Services Revenue Fire Prevention and Inspection - Arkona FD 57,711.89 28,488.50 29,223.39 49.36% Northville FD 9,778.83 4,391.04 5,387.79 44.90% Forest FD 58,114.85 28,277.72 29,837.13 48.66% Grand Bend FD 68,031.65 33,235.44 34,796.21 48.85% <strong>The</strong>dford FD 9,880.65 5,040.33 4,840.32 51.01% Sub Total 203,517.87 99,433.03 104,084.84 48.86% Expense Fire Prevention and Inspection 5,202.00 6,732.42 (1,530.42) 129.42% Arkona FD 164,678.45 50,732.37 113,946.08 30.81% Northville FD 172,926.12 60,076.61 112,849.51 34.74% Forest FD 204,115.26 67,365.44 136,749.82 33.00% Grand Bend FD 201,088.54 70,545.02 130,543.52 35.08% <strong>The</strong>dford FD 196,957.72 64,724.72 132,233.00 32.86% Sub Total 944,968.09 320,176.58 624,791.51 33.88% Fire Total 741,450.22 220,743.55 520,706.67 29.77% Transportation Services Revenue Roadways 912,599.43 449,966.73 462,632.70 49.31% Winter Control 277,776.38 138,888.19 138,888.19 50.00% Street Light / Traffic Control 111,304.60 55,652.30 55,652.30 50.00% Sub Total 1,301,680.41 644,507.22 657,173.19 49.51% Expense TRF to Equipment Replacement RF 318,325.99 318,325.99 0.00% TRF to Road Purposes RF 1,208,241.56 1,208,241.56 0.00% Roadways 1,873,894.35 914,034.34 959,860.01 48.78% Winter Control 583,263.52 303,595.53 279,667.99 52.05% Street Light / Traffic Control 233,712.87 72,193.89 161,518.98 30.89% Sub Total 4,217,438.29 1,289,823.76 2,927,614.53 30.58% Transportation Services Total 2,915,757.88 645,316.54 2,270,441.34 22.13% Harbours Revenue Grand Bend 368,032.80 160,217.97 207,814.83 43.53% Port Franks 193,500.04 168,011.19 25,488.85 86.83% Sub Total 561,532.84 328,229.16 233,303.68 58.45% Expense Grand Bend 348,109.62 117,336.72 230,772.90 33.71% Port Franks 210,941.94 120,927.26 90,014.68 57.33% Sub Total 559,051.56 238,263.98 320,787.58 42.62% Habours Total (2,481.28) (89,965.18) 87,483.90 3625.76% 242 Page 2 <strong>of</strong> 4 7/04/12
- Page 1 and 2:
THE CORPORATION OF THE MUNICIPALITY
- Page 3 and 4:
8.4 PL Report No. 20-2012 - Re: Dee
- Page 5 and 6:
13.1 An opportunity for Members of
- Page 7 and 8:
3. CONFIRMATION OF MINUTES FROM PRE
- Page 9 and 10:
7.4 Review of Brian Boyle`s Strateg
- Page 11 and 12:
5. ADMINISTRATOR’S REPORT AR 05-1
- Page 13:
8 ADJOURN BIA 0512-6 Moved by: Celi
- Page 22 and 23:
THE CORPORATION OF THE MUNICIPALITY
- Page 24 and 25:
6. What economic partnerships with
- Page 26 and 27:
THE CORPORATION OF THE MUNICIPALITY
- Page 28 and 29:
The scope is broad, but statistical
- Page 30 and 31:
seriously considered, should Counci
- Page 32 and 33:
THE CORPORATION OF THE MUNICIPALITY
- Page 34 and 35:
elates to agriculture and food proc
- Page 36 and 37:
Councillor Bonesteel commented that
- Page 38 and 39:
Mr. VanValkenburg’s goal is to ha
- Page 40 and 41:
directly to local dealerships with
- Page 42 and 43:
Because this is an RFP the contract
- Page 44 and 45:
need to be resurfaced. This will be
- Page 46 and 47:
THE CORPORATION OF THE MUNICIPALITY
- Page 48 and 49:
THE CORPORATION OF THE MUNICIPALITY
- Page 50 and 51:
THE MUNICIPALITY OF LAMBTON SHORES
- Page 52 and 53:
2. That the Owner satisfy the Munic
- Page 54 and 55:
June permit fees are slightly highe
- Page 56 and 57:
1 LAMBTON SHORES Multi Year Compari
- Page 58 and 59:
THE CORPORATION OF THE MUNICIPALITY
- Page 60 and 61:
Councillor Russell proposed four re
- Page 62 and 63:
12-0612-05 Moved by: Deputy Mayor D
- Page 64 and 65:
THE CORPORATION OF THE MUNICIPALITY
- Page 66 and 67:
designated spaces for businesses wh
- Page 68 and 69:
That the Grand Bend Canada Day Cele
- Page 70 and 71:
That a request from Jessica Thwaite
- Page 72 and 73:
That By-law 63-2012 authorizing the
- Page 74 and 75:
That the required amendment to By-l
- Page 76 and 77:
- By-law 69-2012 - Re: Confirming R
- Page 78 and 79:
some help with planting bush and tr
- Page 80 and 81:
Adopting regulatory standards that
- Page 82 and 83:
Economic Partnership, Grand Bend Ch
- Page 84 and 85:
Attention: Mayor Bill Weber andLamb
- Page 88 and 89:
From: John & Pat Eplett [mailto:jep
- Page 90 and 91:
Lambton Shores Nature Trails (LSNT)
- Page 92 and 93:
THE MUNICIPALITY OF LAMBTON SHORES
- Page 94 and 95:
THE MUNCIPALITY OF LAMBTON SHORES P
- Page 105 and 106:
100
- Page 107 and 108:
102
- Page 109 and 110:
THE MUNCIPALITY OF LAMBTON SHORES P
- Page 111 and 112:
106
- Page 113 and 114:
The septic system has been replaced
- Page 115 and 116:
and “AGRICULTURAL 1.49- (A1-49)
- Page 117 and 118:
THE CORPORATION OF THE MUNICIPALITY
- Page 119 and 120:
AMENDMENT NO. 32 TO THE MUNICIPALIT
- Page 121 and 122:
THE CORPORATION OF THE MUNICIPALITY
- Page 123 and 124:
-1- STATEMENT OF COMPONENTS PART A
- Page 125 and 126:
ii) iii) iv) only one non-farm sing
- Page 127 and 128:
-5- PART B - THE AMENDMENT Introduc
- Page 129 and 130:
-7- PART C - THE APPENDIX The follo
- Page 131 and 132:
an amendment to the “Agricultural
- Page 133 and 134:
Finally, Section 2.3.3.3 states:
- Page 135 and 136:
OFFICIAL PLAN AMENDMENT APPLICATION
- Page 137 and 138:
Respectfully submitted Patti L. Ric
- Page 139 and 140:
THE MUNCIPALITY OF LAMBTON SHORES P
- Page 141 and 142:
THIS AGREEMENT made the day of July
- Page 143 and 144:
THE MUNICIPALITY OF LAMBTON SHORES
- Page 145 and 146:
Attachment 1 The Municipality of La
- Page 147 and 148:
Historical Precedent Existing Prefe
- Page 149 and 150:
THE MUNICIPALITY OF LAMBTON SHORES
- Page 151 and 152:
The selection committee will be pro
- Page 153 and 154:
Lambton Shores community organizati
- Page 155 and 156:
Appendix A Volunteer Appreciation A
- Page 157 and 158:
Email: ____________________________
- Page 159 and 160:
Appendix B Accessibility Award Muni
- Page 161 and 162:
Ontario Newcomer Champion Award: Re
- Page 163 and 164:
Through Lambton Shores Community Gr
- Page 165 and 166:
CHIPPEWAS OF KETTLE AND STONY POINT
- Page 167 and 168:
Aquafest 2012 Revenue TD Environmen
- Page 169 and 170:
the community. Other programs would
- Page 171 and 172:
Facilitating partnerships with exte
- Page 173 and 174:
THE MUNICIPALITY OF LAMBTON SHORES
- Page 175 and 176:
In February of this year, the Lambt
- Page 177 and 178:
approved by September 14, 2012, and
- Page 179 and 180:
SW Lambton Shores Tuesday Pick Up A
- Page 181 and 182:
THE MUNICIPALITY OF LAMBTON SHORES
- Page 183 and 184:
THE CORPORATION OF THE MUNICIPALITY
- Page 185 and 186:
It is staff’s recommendation to c
- Page 187 and 188:
Watson & Associates Economists Ltd.
- Page 189 and 190:
Watson & Associates Economists Ltd.
- Page 191 and 192:
Watson & Associates Economists Ltd.
- Page 193 and 194:
Watson & Associates Economists Ltd.
- Page 195 and 196: Watson & Associates Economists Ltd.
- Page 197 and 198: Watson & Associates Economists Ltd.
- Page 199 and 200: Watson & Associates Economists Ltd.
- Page 201 and 202: 196
- Page 203 and 204: OUR PHILOSOPHY At Watson & Associat
- Page 205 and 206: OUR SERVICES We offer our clients a
- Page 207 and 208: Experience in Water and Wastewater
- Page 209 and 210: Experience in Water and Wastewater
- Page 211 and 212: Experience in Ontario Regulation 45
- Page 213 and 214: Staff Resources GARY D. SCANDLAN, B
- Page 215 and 216: Staff Resources DAN WILSON, BBA, CA
- Page 217 and 218: 4304 Village Centre Court Mississau
- Page 219 and 220: Watson & Associates Economists Ltd.
- Page 221 and 222: Watson & Associates Economists Ltd.
- Page 223 and 224: Watson & Associates Economists Ltd.
- Page 225 and 226: 220
- Page 227 and 228: OUR PHILOSOPHY At Watson & Associat
- Page 229 and 230: OUR SERVICES We offer our clients a
- Page 231 and 232: Experience in Water and Wastewater
- Page 233 and 234: Experience in Water and Wastewater
- Page 235 and 236: Experience in Ontario Regulation 45
- Page 237 and 238: Staff Resources GARY D. SCANDLAN, B
- Page 239 and 240: Staff Resources DAN WILSON, BBA, CA
- Page 241 and 242: THE MUNICIPALITY OF LAMBTON SHORES
- Page 243 and 244: 238
- Page 245: Arenas All operating accounts curr
- Page 249 and 250: MUNICIPALITY OF LAMBTON SHORES 2012
- Page 251 and 252: Municipality of Lambton Shores 2012
- Page 253 and 254: Municipality of Lambton Shores 2012
- Page 255 and 256: The Community Services Department h
- Page 257 and 258: From: Sarah Duplisea To: jrussell@
- Page 259 and 260: 5. People need to know why they sho
- Page 261 and 262: 256
- Page 263 and 264: THE MUNICIPALITY OF LAMBTON SHORES
- Page 265 and 266: AUTHORIZED REPRESENTATIVE AGREEMENT
- Page 267 and 268: 3 5 Term and Termination This Agree
- Page 269 and 270: 5 SCHEDULE OF AUTHORIZED SALES REPR
- Page 271 and 272: agricultural buildings would be sim
- Page 273 and 274: 268
- Page 275 and 276: 270
- Page 277 and 278: 272
- Page 279 and 280: 274
- Page 281 and 282: 276
- Page 283 and 284: 278
- Page 285 and 286: 280
- Page 287 and 288: 282
- Page 289 and 290: 284
- Page 291 and 292: 286
- Page 293 and 294: 288
- Page 295 and 296: 290
- Page 297 and 298:
292
- Page 299 and 300:
294
- Page 301 and 302:
296
- Page 303 and 304:
298
- Page 305 and 306:
300
- Page 307 and 308:
302
- Page 309 and 310:
304
- Page 311 and 312:
306
- Page 313 and 314:
308
- Page 315 and 316:
310
- Page 317 and 318:
312
- Page 319 and 320:
314
- Page 321 and 322:
316
- Page 323 and 324:
318
- Page 325 and 326:
320
- Page 327 and 328:
322
- Page 329 and 330:
324
- Page 331 and 332:
326
- Page 333 and 334:
THE MUNICIPALITY OF LAMBTON SHORES
- Page 335 and 336:
If Council is supportive of the dra
- Page 337 and 338:
THE CORPORATION OF THE MUNICIPALITY
- Page 339 and 340:
THE CORPORATION OF THE MUNICIPALITY
- Page 341 and 342:
Municipality of Lambton Shores May
- Page 343 and 344:
Municipality of Lambton Shores May
- Page 345 and 346:
Municipality of Lambton Shores May
- Page 347 and 348:
Municipality of Lambton Shores June
- Page 349 and 350:
Municipality of Lambton Shores June
- Page 351 and 352:
Municipality of Lambton Shores June