The role of metacognitive skills in learning to solve problems
The role of metacognitive skills in learning to solve problems
The role of metacognitive skills in learning to solve problems

Create successful ePaper yourself
Turn your PDF publications into a flip-book with our unique Google optimized e-Paper software.
Study III: added value <strong>of</strong> the task model 131<br />
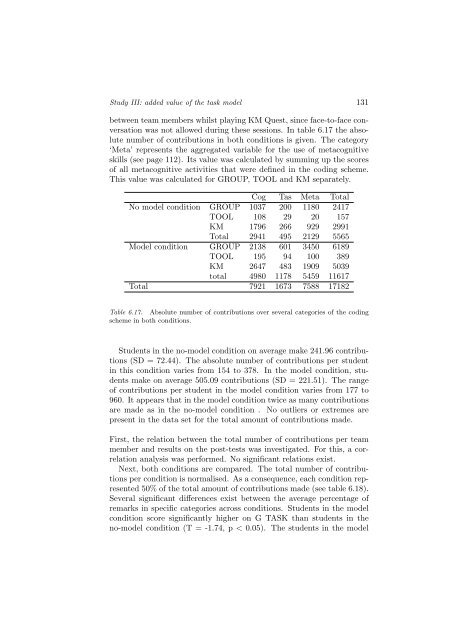
between team members whilst play<strong>in</strong>g KM Quest, s<strong>in</strong>ce face-<strong>to</strong>-face conversation<br />
was not allowed dur<strong>in</strong>g these sessions. In table 6.17 the absolute<br />
number <strong>of</strong> contributions <strong>in</strong> both conditions is given. <strong>The</strong> category<br />
‘Meta’ represents the aggregated variable for the use <strong>of</strong> <strong>metacognitive</strong><br />
<strong>skills</strong> (see page 112). Its value was calculated by summ<strong>in</strong>g up the scores<br />
<strong>of</strong> all <strong>metacognitive</strong> activities that were def<strong>in</strong>ed <strong>in</strong> the cod<strong>in</strong>g scheme.<br />
This value was calculated for GROUP, TOOL and KM separately.<br />
Cog Tas Meta Total<br />
No model condition GROUP 1037 200 1180 2417<br />
TOOL 108 29 20 157<br />
KM 1796 266 929 2991<br />
Total 2941 495 2129 5565<br />
Model condition GROUP 2138 601 3450 6189<br />
TOOL 195 94 100 389<br />
KM 2647 483 1909 5039<br />
<strong>to</strong>tal 4980 1178 5459 11617<br />
Total 7921 1673 7588 17182<br />
Table 6.17. Absolute number <strong>of</strong> contributions over several categories <strong>of</strong> the cod<strong>in</strong>g<br />
scheme <strong>in</strong> both conditions.<br />
Students <strong>in</strong> the no-model condition on average make 241.96 contributions<br />
(SD = 72.44). <strong>The</strong> absolute number <strong>of</strong> contributions per student<br />
<strong>in</strong> this condition varies from 154 <strong>to</strong> 378. In the model condition, students<br />
make on average 505.09 contributions (SD = 221.51). <strong>The</strong> range<br />
<strong>of</strong> contributions per student <strong>in</strong> the model condition varies from 177 <strong>to</strong><br />
960. It appears that <strong>in</strong> the model condition twice as many contributions<br />
are made as <strong>in</strong> the no-model condition . No outliers or extremes are<br />
present <strong>in</strong> the data set for the <strong>to</strong>tal amount <strong>of</strong> contributions made.<br />
First, the relation between the <strong>to</strong>tal number <strong>of</strong> contributions per team<br />
member and results on the post-tests was <strong>in</strong>vestigated. For this, a correlation<br />
analysis was performed. No significant relations exist.<br />
Next, both conditions are compared. <strong>The</strong> <strong>to</strong>tal number <strong>of</strong> contributions<br />
per condition is normalised. As a consequence, each condition represented<br />
50% <strong>of</strong> the <strong>to</strong>tal amount <strong>of</strong> contributions made (see table 6.18).<br />
Several significant differences exist between the average percentage <strong>of</strong><br />
remarks <strong>in</strong> specific categories across conditions. Students <strong>in</strong> the model<br />
condition score significantly higher on G TASK than students <strong>in</strong> the<br />
no-model condition (T = -1.74, p < 0.05). <strong>The</strong> students <strong>in</strong> the model