

Rotational Raman scattering in the Earth's atmosphere ... - SRON
Rotational Raman scattering in the Earth's atmosphere ... - SRON
Rotational Raman scattering in the Earth's atmosphere ... - SRON

Create successful ePaper yourself
Turn your PDF publications into a flip-book with our unique Google optimized e-Paper software.
4 Chapter 1<br />
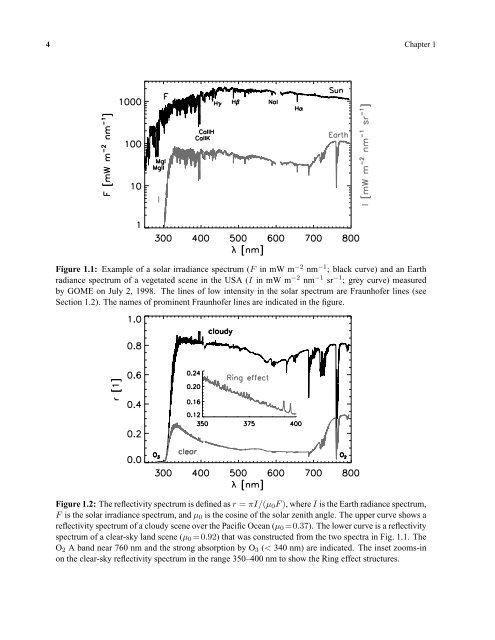
Figure 1.1: Example of a solar irradiance spectrum (F <strong>in</strong> mW m −2 nm −1 ; black curve) and an Earth<br />
radiance spectrum of a vegetated scene <strong>in</strong> <strong>the</strong> USA (I <strong>in</strong> mW m −2 nm −1 sr −1 ; grey curve) measured<br />
by GOME on July 2, 1998. The l<strong>in</strong>es of low <strong>in</strong>tensity <strong>in</strong> <strong>the</strong> solar spectrum are Fraunhofer l<strong>in</strong>es (see<br />
Section 1.2). The names of prom<strong>in</strong>ent Fraunhofer l<strong>in</strong>es are <strong>in</strong>dicated <strong>in</strong> <strong>the</strong> figure.<br />
Figure 1.2: The reflectivity spectrum is def<strong>in</strong>ed as r = πI/(µ 0 F), where I is <strong>the</strong> Earth radiance spectrum,<br />
F is <strong>the</strong> solar irradiance spectrum, and µ 0 is <strong>the</strong> cos<strong>in</strong>e of <strong>the</strong> solar zenith angle. The upper curve shows a<br />
reflectivity spectrum of a cloudy scene over <strong>the</strong> Pacific Ocean (µ 0 =0.37). The lower curve is a reflectivity<br />
spectrum of a clear-sky land scene (µ 0 =0.92) that was constructed from <strong>the</strong> two spectra <strong>in</strong> Fig. 1.1. The<br />
O 2 A band near 760 nm and <strong>the</strong> strong absorption by O 3 (< 340 nm) are <strong>in</strong>dicated. The <strong>in</strong>set zooms-<strong>in</strong><br />
on <strong>the</strong> clear-sky reflectivity spectrum <strong>in</strong> <strong>the</strong> range 350–400 nm to show <strong>the</strong> R<strong>in</strong>g effect structures.


