

Rotational Raman scattering in the Earth's atmosphere ... - SRON
Rotational Raman scattering in the Earth's atmosphere ... - SRON
Rotational Raman scattering in the Earth's atmosphere ... - SRON

You also want an ePaper? Increase the reach of your titles
YUMPU automatically turns print PDFs into web optimized ePapers that Google loves.
90 Chapter 4<br />
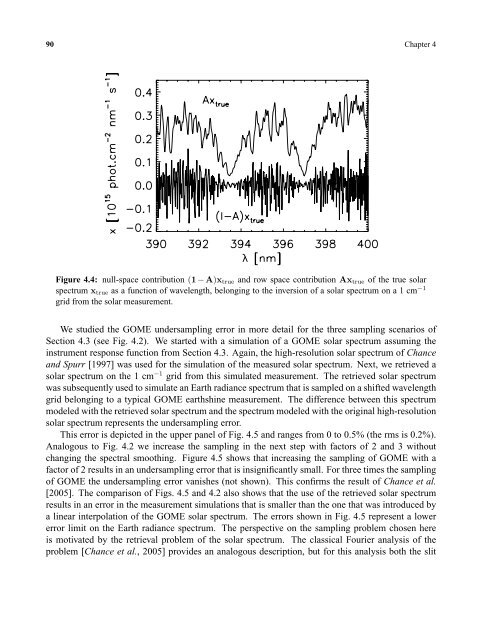
Figure 4.4: null-space contribution (1 −A)x true and row space contribution Ax true of <strong>the</strong> true solar<br />
spectrum x true as a function of wavelength, belong<strong>in</strong>g to <strong>the</strong> <strong>in</strong>version of a solar spectrum on a 1 cm −1<br />
grid from <strong>the</strong> solar measurement.<br />
We studied <strong>the</strong> GOME undersampl<strong>in</strong>g error <strong>in</strong> more detail for <strong>the</strong> three sampl<strong>in</strong>g scenarios of<br />
Section 4.3 (see Fig. 4.2). We started with a simulation of a GOME solar spectrum assum<strong>in</strong>g <strong>the</strong><br />
<strong>in</strong>strument response function from Section 4.3. Aga<strong>in</strong>, <strong>the</strong> high-resolution solar spectrum of Chance<br />
and Spurr [1997] was used for <strong>the</strong> simulation of <strong>the</strong> measured solar spectrum. Next, we retrieved a<br />
solar spectrum on <strong>the</strong> 1 cm −1 grid from this simulated measurement. The retrieved solar spectrum<br />
was subsequently used to simulate an Earth radiance spectrum that is sampled on a shifted wavelength<br />
grid belong<strong>in</strong>g to a typical GOME earthsh<strong>in</strong>e measurement. The difference between this spectrum<br />
modeled with <strong>the</strong> retrieved solar spectrum and <strong>the</strong> spectrum modeled with <strong>the</strong> orig<strong>in</strong>al high-resolution<br />
solar spectrum represents <strong>the</strong> undersampl<strong>in</strong>g error.<br />
This error is depicted <strong>in</strong> <strong>the</strong> upper panel of Fig. 4.5 and ranges from 0 to 0.5% (<strong>the</strong> rms is 0.2%).<br />
Analogous to Fig. 4.2 we <strong>in</strong>crease <strong>the</strong> sampl<strong>in</strong>g <strong>in</strong> <strong>the</strong> next step with factors of 2 and 3 without<br />
chang<strong>in</strong>g <strong>the</strong> spectral smooth<strong>in</strong>g. Figure 4.5 shows that <strong>in</strong>creas<strong>in</strong>g <strong>the</strong> sampl<strong>in</strong>g of GOME with a<br />
factor of 2 results <strong>in</strong> an undersampl<strong>in</strong>g error that is <strong>in</strong>significantly small. For three times <strong>the</strong> sampl<strong>in</strong>g<br />
of GOME <strong>the</strong> undersampl<strong>in</strong>g error vanishes (not shown). This confirms <strong>the</strong> result of Chance et al.<br />
[2005]. The comparison of Figs. 4.5 and 4.2 also shows that <strong>the</strong> use of <strong>the</strong> retrieved solar spectrum<br />
results <strong>in</strong> an error <strong>in</strong> <strong>the</strong> measurement simulations that is smaller than <strong>the</strong> one that was <strong>in</strong>troduced by<br />
a l<strong>in</strong>ear <strong>in</strong>terpolation of <strong>the</strong> GOME solar spectrum. The errors shown <strong>in</strong> Fig. 4.5 represent a lower<br />
error limit on <strong>the</strong> Earth radiance spectrum. The perspective on <strong>the</strong> sampl<strong>in</strong>g problem chosen here<br />
is motivated by <strong>the</strong> retrieval problem of <strong>the</strong> solar spectrum. The classical Fourier analysis of <strong>the</strong><br />
problem [Chance et al., 2005] provides an analogous description, but for this analysis both <strong>the</strong> slit


