

Rotational Raman scattering in the Earth's atmosphere ... - SRON
Rotational Raman scattering in the Earth's atmosphere ... - SRON
Rotational Raman scattering in the Earth's atmosphere ... - SRON

You also want an ePaper? Increase the reach of your titles
YUMPU automatically turns print PDFs into web optimized ePapers that Google loves.
2 Chapter 1<br />
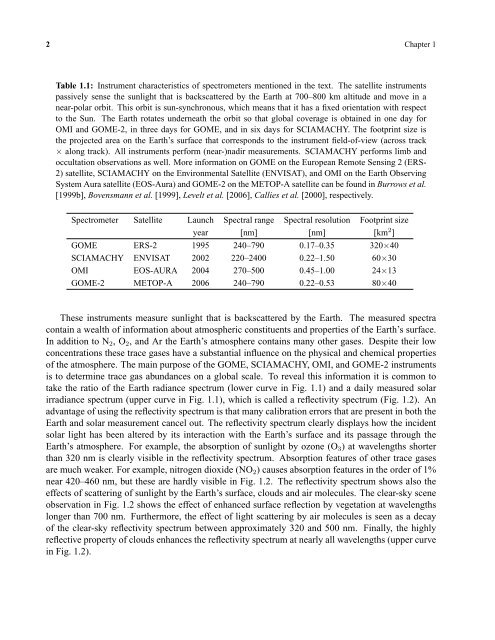
Table 1.1: Instrument characteristics of spectrometers mentioned <strong>in</strong> <strong>the</strong> text. The satellite <strong>in</strong>struments<br />
passively sense <strong>the</strong> sunlight that is backscattered by <strong>the</strong> Earth at 700–800 km altitude and move <strong>in</strong> a<br />
near-polar orbit. This orbit is sun-synchronous, which means that it has a fixed orientation with respect<br />
to <strong>the</strong> Sun. The Earth rotates underneath <strong>the</strong> orbit so that global coverage is obta<strong>in</strong>ed <strong>in</strong> one day for<br />
OMI and GOME-2, <strong>in</strong> three days for GOME, and <strong>in</strong> six days for SCIAMACHY. The footpr<strong>in</strong>t size is<br />
<strong>the</strong> projected area on <strong>the</strong> Earth’s surface that corresponds to <strong>the</strong> <strong>in</strong>strument field-of-view (across track<br />
× along track). All <strong>in</strong>struments perform (near-)nadir measurements. SCIAMACHY performs limb and<br />
occultation observations as well. More <strong>in</strong>formation on GOME on <strong>the</strong> European Remote Sens<strong>in</strong>g 2 (ERS-<br />
2) satellite, SCIAMACHY on <strong>the</strong> Environmental Satellite (ENVISAT), and OMI on <strong>the</strong> Earth Observ<strong>in</strong>g<br />
System Aura satellite (EOS-Aura) and GOME-2 on <strong>the</strong> METOP-A satellite can be found <strong>in</strong> Burrows et al.<br />
[1999b], Bovensmann et al. [1999], Levelt et al. [2006], Callies et al. [2000], respectively.<br />
Spectrometer Satellite Launch Spectral range Spectral resolution Footpr<strong>in</strong>t size<br />
year [nm] [nm] [km 2 ]<br />
GOME ERS-2 1995 240–790 0.17–0.35 320×40<br />
SCIAMACHY ENVISAT 2002 220–2400 0.22–1.50 60×30<br />
OMI EOS-AURA 2004 270–500 0.45–1.00 24×13<br />
GOME-2 METOP-A 2006 240–790 0.22–0.53 80×40<br />
These <strong>in</strong>struments measure sunlight that is backscattered by <strong>the</strong> Earth. The measured spectra<br />
conta<strong>in</strong> a wealth of <strong>in</strong>formation about atmospheric constituents and properties of <strong>the</strong> Earth’s surface.<br />
In addition to N 2 , O 2 , and Ar <strong>the</strong> Earth’s <strong>atmosphere</strong> conta<strong>in</strong>s many o<strong>the</strong>r gases. Despite <strong>the</strong>ir low<br />
concentrations <strong>the</strong>se trace gases have a substantial <strong>in</strong>fluence on <strong>the</strong> physical and chemical properties<br />
of <strong>the</strong> <strong>atmosphere</strong>. The ma<strong>in</strong> purpose of <strong>the</strong> GOME, SCIAMACHY, OMI, and GOME-2 <strong>in</strong>struments<br />
is to determ<strong>in</strong>e trace gas abundances on a global scale. To reveal this <strong>in</strong>formation it is common to<br />
take <strong>the</strong> ratio of <strong>the</strong> Earth radiance spectrum (lower curve <strong>in</strong> Fig. 1.1) and a daily measured solar<br />
irradiance spectrum (upper curve <strong>in</strong> Fig. 1.1), which is called a reflectivity spectrum (Fig. 1.2). An<br />
advantage of us<strong>in</strong>g <strong>the</strong> reflectivity spectrum is that many calibration errors that are present <strong>in</strong> both <strong>the</strong><br />
Earth and solar measurement cancel out. The reflectivity spectrum clearly displays how <strong>the</strong> <strong>in</strong>cident<br />
solar light has been altered by its <strong>in</strong>teraction with <strong>the</strong> Earth’s surface and its passage through <strong>the</strong><br />
Earth’s <strong>atmosphere</strong>. For example, <strong>the</strong> absorption of sunlight by ozone (O 3 ) at wavelengths shorter<br />
than 320 nm is clearly visible <strong>in</strong> <strong>the</strong> reflectivity spectrum. Absorption features of o<strong>the</strong>r trace gases<br />
are much weaker. For example, nitrogen dioxide (NO 2 ) causes absorption features <strong>in</strong> <strong>the</strong> order of 1%<br />
near 420–460 nm, but <strong>the</strong>se are hardly visible <strong>in</strong> Fig. 1.2. The reflectivity spectrum shows also <strong>the</strong><br />
effects of <strong>scatter<strong>in</strong>g</strong> of sunlight by <strong>the</strong> Earth’s surface, clouds and air molecules. The clear-sky scene<br />
observation <strong>in</strong> Fig. 1.2 shows <strong>the</strong> effect of enhanced surface reflection by vegetation at wavelengths<br />
longer than 700 nm. Fur<strong>the</strong>rmore, <strong>the</strong> effect of light <strong>scatter<strong>in</strong>g</strong> by air molecules is seen as a decay<br />
of <strong>the</strong> clear-sky reflectivity spectrum between approximately 320 and 500 nm. F<strong>in</strong>ally, <strong>the</strong> highly<br />
reflective property of clouds enhances <strong>the</strong> reflectivity spectrum at nearly all wavelengths (upper curve<br />
<strong>in</strong> Fig. 1.2).


