FIBEROPTIC SENSOR TECHNOLOGY HANDBOOK
FIBEROPTIC SENSOR TECHNOLOGY HANDBOOK
FIBEROPTIC SENSOR TECHNOLOGY HANDBOOK

Create successful ePaper yourself
Turn your PDF publications into a flip-book with our unique Google optimized e-Paper software.
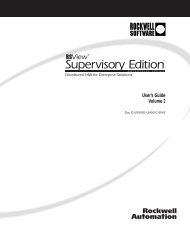
The vertical height of the various cross-hatched regions<br />
represent the loss as a function nf the wavelength<br />
arising from the various sources. Note that the<br />
minimum total attenuation at approximately 0.8 micron<br />
wavelength is approximately 10 dB/km. This is a somewhat<br />
mediocre fiber by today’s standards. The lowest<br />
four regions in Fig. 2.17 correspond to the loss due<br />
to 1 part per million by weight, in silicon oxide (Si02)<br />
glass, of the metallic impurities Cu, Ni, Fe, and Cr,<br />
from bottom to top, respectively. The peak in the<br />
vicinity of the 0.95-micron wavelength is due to the<br />
third harmonic of the hydroxyl (OH-) vibrational mode,<br />
and corresponds to roughly a 20-part-per-million impurity<br />
content. The black dots are predicted values of<br />
losses based on calorimetry-type optical absorption<br />
measurements made on the glass sample from which the<br />
fiber was drawn. The upper cross-hatched region represents<br />
the attenuation due to Rayleigh scattering while<br />
the white region is the remaining difference between<br />
the total loss versus wavelength (the uppermost curve)<br />
and the sum of the previously mentioned losses. The<br />
latter is attributed to regular bending and microbending<br />
losses.<br />
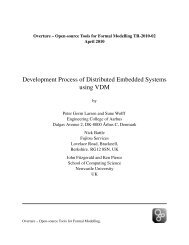
The attenuation versus wavelength curve shown<br />
in Fig. 2.18 is for a currently available very-low-<br />
5.0 . ‘.<br />
3.0 — ‘.> ‘.<br />
2.0 —<br />
‘\<br />
1.0<br />
tion. In the bent region, the ray intersects the corecladding<br />
interface at an angle 13 that is greater than<br />
‘dC and thus it will be partially transmitted out of the<br />
core and into the cladding. This will occur at each<br />
successive reflection from the outer interface and large<br />
losses may occur. Another qualitative explanation of<br />
this type of loss is as follows. In the beam propagating<br />
in the fiber, assuming plane wavefronts, if the<br />
velocity at the center of the core in the bent section<br />
were equal to the c/nl, the “proper” velocity in the<br />
core, then the velocity at the outer edge of the front<br />
would have to be higher than c/nl, which cannot occur.<br />
Radiation in the form of core-to-cladding scattering<br />
results. Finally, from the electromagnetic wave theory<br />
it may be shown that in a waveguide with a constant<br />
bend radius, all of the solutions of the wave equation<br />
represent waves that decay with<br />
along the centerline of the core.<br />
increasing distance<br />
6<br />
6< 9.<br />
e’ 70,<br />
\<br />
/<br />
/<br />
/<br />
0.5 -<br />
\<br />
Fig. 2.19 Leakage of optical power froman optical<br />
fiber at a constant-radius bend.<br />
Fig. 2.18<br />
0.6 0.7 0.8 0.9 1.0 1.1 1.2 1.3 1.4 1.5 1.6<br />
WAVELENGTH (pm)’<br />
Attenuation rate of optical power in a low-<br />
10SS optical fiber as a function of wavelength.<br />
The arrows along the abscissa indicate<br />
the wavelengths of commercially<br />
available lasers.<br />
loss, single mode fiber. The arrows along the lower<br />
abscissa correspond to the wavelengths of currently<br />
available lasers. The peak in the loss curve at the<br />
1.4-micron wavelength is due to the OH- radical, which<br />
has been reduced to a relatively low concentration<br />
level. The minimum at approximately the 1.3 micron<br />
wavelength is of special interest, not only because the<br />
attenuation rate is down to 0.5 dB/km, but also because<br />
this wavelength is very close to the zero-dispersion<br />
wavelength of Si02 which is of special interest in some<br />
applications, as will be discussed shortly. Fig. 2.18<br />
shows that extremely low attenuation rates attainable<br />
with current fiber fabrication techniques at wave -<br />
lengths where high intensity long-life, solid state<br />
laser sources are becoming commercially available. It<br />
is now up to the fiber user to devise techniques and<br />
configurations that can maintain this low loss by not<br />
introducing significant regular (macro) bending and<br />
microbending losses.<br />
Using the latter approach it is possible to<br />
compute the expected loss due to a constant bend radius.<br />
The results of such calculations are shown in Fig. 2.20,<br />
where loss curves versus bend radius are shown for<br />
singlemode fibers at the 0.83-micron wavelength having<br />
different numerical aperture (N.A.). Note the strong<br />
dependence on bend radius and N.A. Referring to Fig.<br />
2.20, consider a fiber with a numerical aperture of<br />
0.1. When a 10-meter length is wound on a l.2-cmradius<br />
mandrel, the attenuation due to bending is approximately<br />
6 dB, i.e., 75 percent of the light energy<br />
injected into the core at the input end is scattered<br />
out of the core while propagating in the ten meters<br />
to the output end. Nhen 10 meters of identical fiber<br />
are wound on a 1.0 cm radius mandrel, the attenuation<br />
due to bending will increase by a factor of about<br />
250,000 to 60 dB, so that only about one millionth of<br />
the original light remains at the end of the fiber.<br />
Just about all of the input light is scattered out of<br />
the core. On the other hand, using the 1.2 cm radius<br />
mandrel and increasing the numerical aperture (N.A.)<br />
to 0.12 reduces these attenuations to 0.16 dB and 1.6<br />
dB, respectively. Therefore, care must be taken in<br />
designing fiberoptic sensors that require bending and<br />
winding of fibers and in specifying fibers for such<br />
applications.<br />
A ray picture of the regular (constant) bend<br />
radius loss mechanfsm is shown in Fig. 2.19. Assume a<br />
ray is traveling to the right at an angle of o less<br />
than the critical angle ec in the straight fiber sec - 2-9