FIBEROPTIC SENSOR TECHNOLOGY HANDBOOK
FIBEROPTIC SENSOR TECHNOLOGY HANDBOOK
FIBEROPTIC SENSOR TECHNOLOGY HANDBOOK

You also want an ePaper? Increase the reach of your titles
YUMPU automatically turns print PDFs into web optimized ePapers that Google loves.
100 meters of fiber, length changes on the order of 0.1<br />
mm can be expected as a result of changes in temperature,<br />
presaure, tension, and other environmental conditions.<br />
Thus, the fluctuation in laser optical output amplitude<br />
is eliminated. The subtraction is actually accomplished<br />
electrically in the differential amplifier following<br />
the photodetector as was shown in Fig. 4.7.<br />
Experimental verification of common mode rejection<br />
is shown in Fig. 4.18 (see Ref. 2 in Subsection<br />
6-<br />
a<br />
II<br />
~ 10.0 ~<br />
k<br />
OUTPUT FROM ONE PORT<br />
F<br />
m<br />
u<br />
(n<br />
u 1.0 -<br />
I<br />
L<br />
w<br />
d<br />
a<br />
01 -<br />
!3 OUTPUT OF BOTH PORTS<br />
u<br />
USING COMMON-MODE REJECTION /<br />
h<br />
a<br />
I<br />
I<br />
01 1 10 100 1000<br />
PATH LENGTH DIFFERENCE (mm)<br />
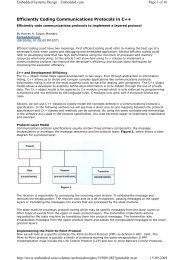
Fig. 4.17 Variation of homodyne interferometer output<br />
noise as a function of sensing arm path<br />
length difference for several output frequencies.<br />
After A. Dandridge, et al., Appl. Phys. Lett. ~, 77<br />
(1981)<br />
4.2.4 Amplitude Noise<br />
Common mode rejection refers to a method for<br />
the elimination of laser amplitude noise. Expressions<br />
for the optical intensity at the two output ports of<br />
the lower 3-dB coupler that was shown in Fig. 4.16 are:<br />
and<br />
11 = (1/2)(1 + ~sin~st) (4.19)<br />
12 = (1/2)(1 - ~sinust) (4.20)<br />
where I is the output optical intensity (power) of the<br />
laser minus the various insertion and fiber absorption<br />
losses. Aa is the amplitude of the phase shift produced<br />
by a signal of angular frequency us. Conservation<br />
of energy dictates the plus and minus signs in Eqs.<br />
(4.19) and (4.20) respectively. Summing Eqs. (4.19)<br />
and (4.20) yields I as required. Multiplying Eqs. (4.19)<br />
and (4.20) by 1 + AI/I where AI/I is an amplitude fluctuation<br />
whose ma nitude is the same order of magnitude<br />
as As, e.g. 10 -5 or 10-6, yields:<br />
and<br />
211 = I + AI + IAssinost (4.21)<br />
212 = I + AI - IAssin@st (4.22)<br />
where higher order terms in the infinitesimals AI/I and<br />
As are neglected. Subtracting Eq. (4.22) fromEq. (4.21)<br />
results in the expression:<br />
11 - 12 = IA a<br />
sinost (4.23)<br />
4-9<br />
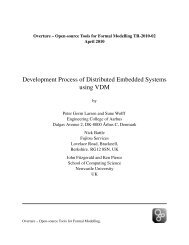
Fig. 4.18 Minimum detectable phase shift versus fre -<br />
quency in a fiberoptic homodyne interferometric<br />
sensor using common-mode rejection<br />
of laser amplitude noise.<br />
After Dandridge and Tveten, Appl. Phys. Lett. ~, 2337<br />
(1981).<br />
4.2.8). The minimum detectable phase shift, expressed in<br />
microradians, is plotted versus frequency. The squares<br />
represent the output from a single port of the interferometer.<br />
The solid line is the average of these points.<br />
The circles are the data obtained when the output from<br />
both of the ports of the interferometer are detected<br />
and the different signals taken. By comparing these<br />
results it is seen that an order of magnitude decrease<br />
in the minimum detectable phase shift is achieved at<br />
low frequency. At frequencies above 1 kHz a minimum detectable<br />
phase shift of 0.1 urad (10-7 radians) is accomplished.<br />
This is representative of the kind of sensitivity<br />
that canbe achieved when common mode rejection<br />
is employed and the arms of the interferometer are<br />
matched to within 1 mm as was the case in this experiment.<br />
Laser noise due to satellite modes and multimode<br />
operation was also eliminated.<br />
4.2.5 Satellite Modea and Multimode Operation<br />
The influence of various amounts of optical<br />
feedback on the modal output of a Hitachic HLP 1400<br />
diode laser is shown by the output spectrum of the<br />
laser plotted for varioua conditions of optical feedback<br />
as shown in Fig. 4.19 (see Ref. 3 in Subsection<br />
4.2.8). Spectrum (a) is for the free running laser with<br />
a spectral width of 5 MHz. The spectra (b), (c), and<br />
(d) illustrate the effect of increasing amounts of feedback<br />
(from 0.04% to 1.5%). Notice that for spectra (b)<br />
and (c) the horizontal scale remains the same (i.e.,<br />
from -0.2 to +0.2 A) but for spectrum (d) the scale has<br />
changed, going from -6.0 to +6.0 A. The second and<br />
third curves correspond to 0.04% and 0.06% feedback.<br />
Here satellite modes appear and increaae as the amount<br />
of feedback increases. Such satellite modes arise as<br />
the result of coupling two resonant cavities: one the<br />
laser itself and the other the resonant cavity formed<br />
by the length of fiber from the laser to the primary<br />
reflection. Effects due to optical feedbacks of up to<br />
0.06% are eliminated when the interferometer lengths<br />
are matched to within lmm.