FIBEROPTIC SENSOR TECHNOLOGY HANDBOOK
FIBEROPTIC SENSOR TECHNOLOGY HANDBOOK
FIBEROPTIC SENSOR TECHNOLOGY HANDBOOK

You also want an ePaper? Increase the reach of your titles
YUMPU automatically turns print PDFs into web optimized ePapers that Google loves.
AIR ACOUSTICS<br />
REFERENCE LEVEL –––<br />
I<br />
UNDERWATER ACOUSTICS<br />
REFERENCE LEVEL . . . . . . - 1 -<br />
Fig. 5.30<br />
TT71 NEWTONIMETER 2<br />
~0 ~B 1 PASCAL (Pa)<br />
1 DYNE/CENTlMETER2<br />
DYNEICENTIMETER2<br />
20 MICRONEWTON/METER2<br />
4’0.0C02<br />
20 MICROPASCAL<br />
26 dB<br />
1 MlCRONEWTONfMETER2<br />
1 MKROPASCAL (#Pa)<br />
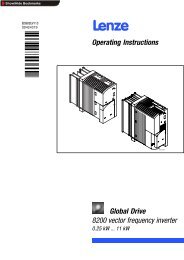
Pressure levels and units for comparison of<br />
underwater acoustic pressure reference<br />
levels.<br />
average minimum detectable sound pressure for humans at<br />
1000 Hz. Another is the currently accepted 1 m.lcronewton/m2<br />
or 1 micropascal (1 ~Pa) reference pressure for<br />
underwater acoustics. To compare these on a decibel<br />
scale, recall first that for a pressure ratio, P1/P2,<br />
the number of decibels, N, in dB, is defined by:<br />
N = 20 loglo P1/P2 (5.18)<br />
Since 0.0002 dynes/cm 2 is equl to 26 upa, the air<br />
acoustic reference pressure is 26 dB above the underwater<br />
reference pressure. Similarl as indicated in<br />
Fig. 5.30, a pressure of 1 dyne/cm J’ is at a level of<br />
74 dB re 0.0002 dyne/cm2 and at a level of 100 dB re<br />
1 pPa. Finally, a pressure of 1 Pa corresponds to 120<br />
dB re 1 pPa and 20 dBre 1 dyne/cm2. The table presented<br />
in Fig. 5.30 is an aid in interpreting hydrophore<br />
characteristics and in performing comparisons presented<br />
here and in later sections.<br />
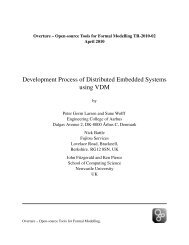
Returning to the consideration of the Hughes-<br />
NRL microbend hydrophore, an experimental evaluation of<br />
the acoustic characteristic of their initial prototype<br />
was conducted at NRL. As indicated in Fig. 5.31, the<br />
hydrophone was placed in an acoustic test tank and measurements<br />
were made of its sensitivity and frequency response<br />
over a frequency range of 200 Hz to 2000 Hz. The<br />
H<br />
~<br />
MODE STRIPPER<br />
u \<br />
results are shown in graphical form in the lower por–<br />
tion of the figure. The minimum detectable pressure,<br />
in a 1 Hz band and at a unity signal-to-noise ratio,<br />
was approximately 100 dB re 1 ma. The 10 dB fluctuations<br />
about this value were attributed to resonances in<br />
the outer case and deformer mount. It should be possible<br />
to eliminate these resonances without much difficulty.<br />
In addition, a significant increase in sensitivity<br />
was achieved in later designs by employing speciallydesigned<br />
graded-index fibers. This was to be expected<br />
since the fiber employed in the initial prototype was<br />
a readily available standard communications step-index<br />
fiber. Such optical fiber has been designed to have<br />
low microbend sensitivity to reduce losses due to bending<br />
introduced in cabling and other field use distortions.<br />
By employing graded-index fibers with enhanced<br />
microbend effects, sensitivity increases of more than<br />
40 dB have been achieved. Thus, these improved microbend<br />
transducers are comparable to many of the more<br />
conventional hydrophores currently in use.<br />
It should be emphasized that with the microbend<br />
transducers discussed above, attempts are made to<br />
detect a very small change in the intensity of a relatively<br />
intense optical beam. This type of sensor is<br />
referred to as a brightfield microbend transducer. A<br />
second type of microbend device, a so called darkfield<br />
transducer, was proposed initially by a group at Catholic<br />
University and currently is under investigation by<br />
several different groups. The sensor is shown in Fig.<br />
5.32. Beginning at the left, it is quite similar in<br />
OPTICAL<br />
SOURCE<br />
Fig. 5.32<br />
FIBER<br />
DEFORMER<br />
MODE<br />
STRIPPER<br />
The microbend darkfield intensity-type fiberoptic<br />
sensor system.<br />
arrangement to the brightfield transducer up to and including<br />
the deformer. As with the brightfield transducer<br />
described above, light, possibly from a broadband<br />
incoherent source, is introduced into a multimode<br />
fiber. Care ia taken to remove cladding light prior to<br />
the deformer. The darkfield transducer differs from<br />
the brightfield transducer in that the light ejected<br />
from the core into the cladding is used to generate the<br />
output signal.<br />
Fig. 5.31 Test arrangement and sensitivity level of<br />
the Hughes Research Laboratories and U.S.<br />
Naval Research Laboratory microbend intensity-type<br />
fiberoptic senaor hydrophore.<br />
After Fields and Cole, APP1. Opt. ~, 3265 (1980)0<br />
5.1 1<br />
As indicated in Fig. 5.32, the Catholic University<br />
group used a more elaborate mode-stripper on<br />
the output section of the fiber (see Ref. 6 in Subsection<br />
5.2.6). The fiber was stripped of ita outer coating<br />
and passed through a small chamber filled with a<br />
refractive-index matching fluid. A number of photodetectors<br />
mounted in the walls of the chamber responded<br />
to changes in the intensity of the core-to-cladding<br />
ejected light. In contrast with brightfield, the darkfield<br />
case has a relatively low level of background<br />
light that is modulated by changes in displacement of<br />
the deformer. The degree” of modulation<br />
-<br />
may be quite<br />
large and thus a very high sensitivity<br />
may be employed without overdriving it.<br />
detectable signals should, in principle,<br />
in the brightfield case. This has been<br />
recent studies.<br />
photodetector<br />
The minimum<br />
be lower than<br />
confirmed in