FIBEROPTIC SENSOR TECHNOLOGY HANDBOOK
FIBEROPTIC SENSOR TECHNOLOGY HANDBOOK
FIBEROPTIC SENSOR TECHNOLOGY HANDBOOK

Create successful ePaper yourself
Turn your PDF publications into a flip-book with our unique Google optimized e-Paper software.
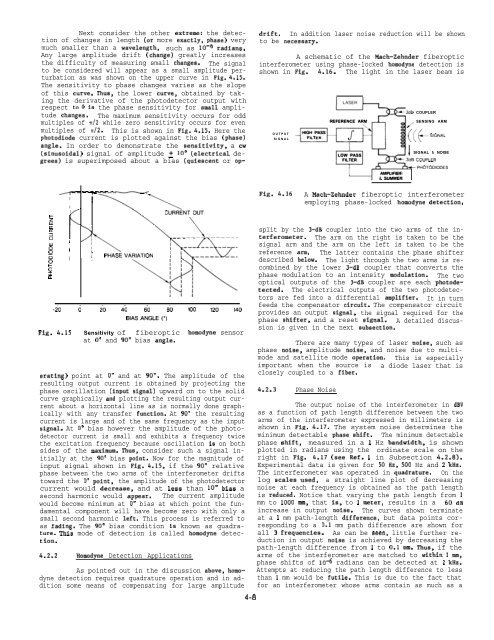
Next consider the other extreme: the detection<br />
of changes in length (or more exactly, phase) very<br />
much smaller than a wavelength, such as 10-6 radians.<br />
Any large amplitude drift (change) greatly increases<br />
the difficulty of measuring small changes. The signal<br />
to be considered will appear as a small amplitude perturbation<br />
as was shown on the upper curve in Fig. 4.15.<br />
The sensitivity to phase changes varies as the slope<br />
of this curve. Thus, the lower curve, obtained by taking<br />
the derivative of the photodetector output with<br />
respect to$ is the phase sensitivity for amall amplitude<br />
changes. The maximum sensitivity occurs for odd<br />
multiples of T/2 while zero sensitivity occurs for even<br />
multiples of n/2. This is shown in Fig. 4.15. Here the<br />
photodiode current is plotted against the bias (phase)<br />
angle. In order to demonstrate the sensitivity, a cw<br />
(sinusoidal) signal of amplitude ~ 10” (electrical degrees)<br />
is superimposed about a bias (quiescent or op-<br />
+<br />
5<br />
K<br />
lx<br />
a<br />
U<br />
8<br />
s<br />
6<br />
1<br />
L<br />
I<br />
I<br />
I<br />
----=-.—.—<br />
I >\<br />
PHASE VARIATION<br />
I<br />
-20 0 20 40 60 80<br />
BIAS ANGLE(”)<br />
CURRENT OUT<br />
II<br />
Fig. 4.15 Sensitivity of fiberoptic<br />
at O“ and 90° bias angle.<br />
100 120 140<br />
homodyne sensor<br />
crating) point at O“ and at 90”. The amplitude of the<br />
resulting output current is obtained by projecting the<br />
phase oscillation (input signal) upward on to the solid<br />
curve graphically and plotting the resulting output current<br />
about a horizontal line as is normally done graphically<br />
with any transfer function. At 90° the resulting<br />
current is large and of the same frequency as the input<br />
signal. At O“ bias however the amplitude of the photodetector<br />
current is small and exhibits a frequency twice<br />
the excitation frequency because oscillation is on both<br />
sides of the maximum. Thus, consider such a signal initially<br />
at the 90” bias point. Now for the magnitude of<br />
input signal shown in Fig. 4.15, if the 90” relative<br />
phase between the two arms of the interferometer drifts<br />
toward the 0° point, the amplitude of the photodetector<br />
current would decrease, and at leas than 10° biaa a<br />
second harmonic would appear. The current amplitude<br />
would become minimum at 0° bias at which point the fundamental<br />
component will have become zero with only a<br />
small second harmonic left. This process is referred to<br />
as fading. The 90” bias condition is known as quadrature.<br />
l%is mode of detection is called homodyne detection.<br />
4.2.2 Homodyne Detection Applications<br />
As pointed out in the discussion above, homodyne<br />
detection requires quadrature operation and in addition<br />
some means of compensating for large amplitude<br />
4-8<br />
drift. In addition laser noise reduction will be shown<br />
to be necessary.<br />
A schematic of the Mach-Zehnder fiberoptic<br />
interferometer using phase-locked homodyne detection is<br />
shown in Fig. 4.16. The light in the laser beam is<br />
3dS COUPLER<br />
REFERENCE ARM<br />
SENSING ARM<br />
/<br />
OUTPUT HIGH PASS<br />
-SIGNAL<br />
SIGNAL“4+ F ILT ER $p<br />
K(<br />
LOW PASS<br />
I<br />
SIGNAL & NOISE<br />
FILTER<br />
3CU3COUPLER<br />
Fig. 4.16<br />
AMPLIFIER<br />
& SUMMER<br />
ePHOTODIODES<br />
A Mach-Zehnder fiberoptic interferometer<br />
employing phase-locked homodyne detection.<br />
split by the 3-dB coupler into the two arms of the interferometer.<br />
The arm on the right is taken to be the<br />
signal arm and the arm on the left is taken to be the<br />
reference arm. The latter contains the phase shifter<br />
described below. The light through the two arms is recombined<br />
by the lower 3-dB coupler that converts the<br />
phase modulation to an intensity modulation. The two<br />
optical outputs of the 3-dB coupler are each photodetected.<br />
The electrical outputs of the two photodetectors<br />
are fed into a differential amplifier. It in turn<br />
feeds the compensator circuit. The compensator circuit<br />
provides an output signal, the signal required for the<br />
phase shifter, and a reset signal. A detailed discussion<br />
is given in the next subsection.<br />
There are many types of laser noise, such as<br />
phase noise, amplitude noise, and noise due to multimode<br />
and satellite mode operation. This is especially<br />
important when the source is a diode laser that is<br />
closely coupled to a fiber.<br />
4.2.3 Phase Noise<br />
The output noise of the interferometer in dBV<br />
as a function of path length difference between the two<br />
arms of the interferometer expressed in millimeters is<br />
shown in Fig. 4.17. The system noise determines the<br />
minimum detectable phaae shift. The minimum detectable<br />
phase shift, measured in a 1 Hz bandwidth, is shown<br />
plotted in radians using the ordinate scale on the<br />
right in Fig. 4.17 (see Ref. 1 in Subsection 4.2.8).<br />
Experimental data is given for 50 Hz, 500 Hz and 2 kHz.<br />
The interferometer was operated in quadrature. On the<br />
log acales used, a straight line plot of decreasing<br />
noise at each frequency is obtained as the path length<br />
is reduced. Notice that varying the path length from 1<br />
mm to 1000 mm, that is, to 1 meter, results in a 60 dB<br />
increase in output noise. The curves shown terminate<br />
at a 1 mm path-length difference, but data points corresponding<br />
to a 0.1 mm path difference are shown for<br />
all 3 frequencies. As can be seen, little further reduction<br />
in output noiae is achieved by decreasing the<br />
path-length difference from 1 to 0.1 mm. Thus, if the<br />
arms of the interferometer are matched to within 1 mm,<br />
phase shifts of 10-6 radians can be detected at 2 kHz.<br />
Attempts at reducing the path length difference to less<br />
than 1 mm would be futile. This is due to the fact that<br />
for an interferometer whose arms contain as much as a