

Local polarization dynamics in ferroelectric materials
Local polarization dynamics in ferroelectric materials
Local polarization dynamics in ferroelectric materials

You also want an ePaper? Increase the reach of your titles
YUMPU automatically turns print PDFs into web optimized ePapers that Google loves.
Rep. Prog. Phys. 73 (2010) 056502<br />
2. Pr<strong>in</strong>ciples and <strong>in</strong>strumental aspects of PFM<br />
S V Kal<strong>in</strong><strong>in</strong> et al<br />
2.1. Basic pr<strong>in</strong>ciples of PFM<br />
The PFM approach for prob<strong>in</strong>g piezo- and <strong>ferroelectric</strong> properties<br />
at the nanoscale is based on the strong coupl<strong>in</strong>g between<br />
<strong>polarization</strong> and electromechanical behavior. Correspond<strong>in</strong>gly,<br />
these behaviors can be addressed by apply<strong>in</strong>g a highly<br />
localized electric field to the material and prob<strong>in</strong>g the resultant<br />
m<strong>in</strong>ute surface displacements with ∼picometer precision.<br />
Atomic force microscopy (AFM) [112] provides an ideal platform<br />
for these studies due to <strong>in</strong>tr<strong>in</strong>sically high vertical resolutions,<br />
and high localization of electric fields at the junction<br />
between the metalized tip and the surface. Hence, PFM is a<br />
contact-mode AFM technique <strong>in</strong> which an electrically biased<br />
conductive AFM tip is used as a probe of local electromechanical<br />
coupl<strong>in</strong>g via the converse piezoelectric effect. Remarkably,<br />
the basic image formation mechanism <strong>in</strong> PFM is complementary<br />
to force-based AFM methods (force is applied and the tip<br />
deflection is measured) and scann<strong>in</strong>g tunnel<strong>in</strong>g microscopy<br />
(STM) [113] (bias is applied, and a current is measured).<br />
This unique mechanism def<strong>in</strong>es all aspects of PFM operation,<br />
<strong>in</strong>clud<strong>in</strong>g resolution, quantitativeness and the potential for the<br />
use of resonance enhancement, as discussed below.<br />
Follow<strong>in</strong>g the <strong>in</strong>vention of STM (1982) and AFM<br />
(1986) [112–114], the first <strong>in</strong>stances of measur<strong>in</strong>g bias<strong>in</strong>duced<br />
sample deformation <strong>in</strong> piezoelectric <strong>materials</strong> by a<br />
scann<strong>in</strong>g probe came <strong>in</strong> 1991 when piezoelectric response, or<br />
piezoresponse (PR), was measured us<strong>in</strong>g scann<strong>in</strong>g acoustic<br />
microscopy [115] and STM [116]. Shortly thereafter, the first<br />
papers on piezoelectric measurements [117] and <strong>ferroelectric</strong><br />
doma<strong>in</strong> visualization [118, 119] by AFM were reported.<br />
Papers by Takata et al [120, 121] (us<strong>in</strong>g stra<strong>in</strong> imag<strong>in</strong>g via<br />
tunnel<strong>in</strong>g acoustic microscopy), Franke et al [122], Kolosov<br />
et al [123], Gruverman et al [124–128] and Hidaka et al<br />
[129] followed. The work of Gruverman et al is particularly<br />
notable for demonstrat<strong>in</strong>g imag<strong>in</strong>g and switch<strong>in</strong>g <strong>in</strong> <strong>in</strong>organic<br />
<strong>ferroelectric</strong>s and co<strong>in</strong><strong>in</strong>g the terms ‘Piezoresponse’ and<br />
‘PFM’ which have now become standard. In the past decade<br />
and a half, PFM has become the premier tool for study<strong>in</strong>g static<br />
and dynamic properties of <strong>ferroelectric</strong> <strong>materials</strong>, as evidenced<br />
by a number of recent books and reviews [106–111]. PFM<br />
has been extended beyond <strong>ferroelectric</strong> th<strong>in</strong> films, ceramics<br />
and crystals to <strong>ferroelectric</strong> polymers [130–137], piezoelectric<br />
semiconductors (GaN [138, 139] AlN [140, 141] and ZnO<br />
[142–144]) and piezoelectric biopolymers, <strong>in</strong>clud<strong>in</strong>g collagen<br />
[145–152] and chit<strong>in</strong> [153, 154].<br />
2.1.1. Elementary theory of PFM. In PFM, a voltage is<br />
applied to a conductive tip<br />
V tip = V dc + V ac cos (ωt) (2.1)<br />
<strong>in</strong> contact with a piezoelectric material. Here V dc is the dc bias<br />
(switch<strong>in</strong>g bias), V ac is the ac bias (prob<strong>in</strong>g bias) and ω is the<br />
ac bias frequency (driv<strong>in</strong>g frequency).<br />
As the sample expands and contracts due to the converse<br />
piezoelectric effect, the tip deflection is monitored us<strong>in</strong>g a<br />
lock-<strong>in</strong> amplifier so that the tip oscillation<br />
A = A 0 + A 1ω cos (ωt + ϕ) , (2.2)<br />
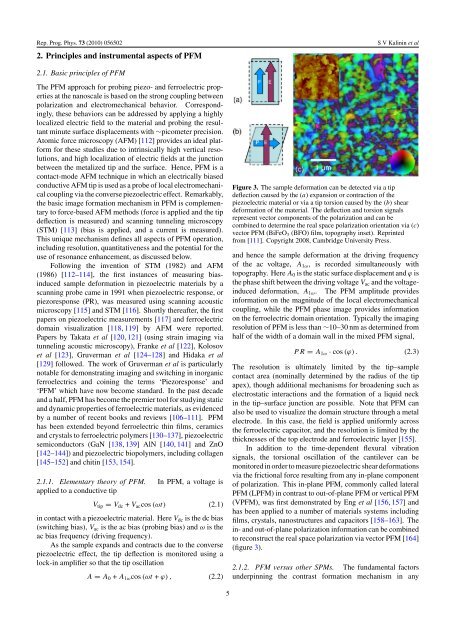
Figure 3. The sample deformation can be detected via a tip<br />
deflection caused by the (a) expansion or contraction of the<br />
piezoelectric material or via a tip torsion caused by the (b) shear<br />
deformation of the material. The deflection and torsion signals<br />
represent vector components of the <strong>polarization</strong> and can be<br />
comb<strong>in</strong>ed to determ<strong>in</strong>e the real space <strong>polarization</strong> orientation via (c)<br />
vector PFM (BiFeO 3 (BFO) film, topography <strong>in</strong>set). Repr<strong>in</strong>ted<br />
from [111]. Copyright 2008, Cambridge University Press.<br />
and hence the sample deformation at the driv<strong>in</strong>g frequency<br />
of the ac voltage, A 1ω , is recorded simultaneously with<br />
topography. Here A 0 is the static surface displacement and ϕ is<br />
the phase shift between the driv<strong>in</strong>g voltage V ac and the voltage<strong>in</strong>duced<br />
deformation, A 1ω . The PFM amplitude provides<br />
<strong>in</strong>formation on the magnitude of the local electromechanical<br />
coupl<strong>in</strong>g, while the PFM phase image provides <strong>in</strong>formation<br />
on the <strong>ferroelectric</strong> doma<strong>in</strong> orientation. Typically the imag<strong>in</strong>g<br />
resolution of PFM is less than ∼10–30 nm as determ<strong>in</strong>ed from<br />
half of the width of a doma<strong>in</strong> wall <strong>in</strong> the mixed PFM signal,<br />
PR = A 1ω · cos (ϕ) . (2.3)<br />
The resolution is ultimately limited by the tip–sample<br />
contact area (nom<strong>in</strong>ally determ<strong>in</strong>ed by the radius of the tip<br />
apex), though additional mechanisms for broaden<strong>in</strong>g such as<br />
electrostatic <strong>in</strong>teractions and the formation of a liquid neck<br />
<strong>in</strong> the tip–surface junction are possible. Note that PFM can<br />
also be used to visualize the doma<strong>in</strong> structure through a metal<br />
electrode. In this case, the field is applied uniformly across<br />
the <strong>ferroelectric</strong> capacitor, and the resolution is limited by the<br />
thicknesses of the top electrode and <strong>ferroelectric</strong> layer [155].<br />
In addition to the time-dependent flexural vibration<br />
signals, the torsional oscillation of the cantilever can be<br />
monitored <strong>in</strong> order to measure piezoelectric shear deformations<br />
via the frictional force result<strong>in</strong>g from any <strong>in</strong>-plane component<br />
of <strong>polarization</strong>. This <strong>in</strong>-plane PFM, commonly called lateral<br />
PFM (LPFM) <strong>in</strong> contrast to out-of-plane PFM or vertical PFM<br />
(VPFM), was first demonstrated by Eng et al [156, 157] and<br />
has been applied to a number of <strong>materials</strong> systems <strong>in</strong>clud<strong>in</strong>g<br />
films, crystals, nanostructures and capacitors [158–163]. The<br />
<strong>in</strong>- and out-of-plane <strong>polarization</strong> <strong>in</strong>formation can be comb<strong>in</strong>ed<br />
to reconstruct the real space <strong>polarization</strong> via vector PFM [164]<br />
(figure 3).<br />
2.1.2. PFM versus other SPMs. The fundamental factors<br />
underp<strong>in</strong>n<strong>in</strong>g the contrast formation mechanism <strong>in</strong> any<br />
5


