

The Quick Count and Election Observation
The Quick Count and Election Observation
The Quick Count and Election Observation

You also want an ePaper? Increase the reach of your titles
YUMPU automatically turns print PDFs into web optimized ePapers that Google loves.
CHAPTER FIVE: STATISTICAL PRINCIPLES AND QUICK COUNTS<br />
68 <strong>The</strong> formula, then, is as follows:<br />
For a dataset containing observations x 1<br />
, x 2<br />
, x 3<br />
… x n<br />
s 2 = (x 1 -x)2 + (x 2 -x) 2 + (x 3 -x) 2 ... (x n -x) 2<br />
n-1<br />
Where<br />
s 2 = variance<br />
x 1<br />
, x 2<br />
, x 3<br />
… x n<br />
are the observations<br />
x is the mean<br />
n is the number of observations<br />
In short form, it appears as:<br />
s 2 =<br />
∑ (x-x)2<br />
n-1<br />
<strong>The</strong> st<strong>and</strong>ard deviation is the square root of the variance. Statisticians usually<br />
rely on the st<strong>and</strong>ard deviation because it expresses the variance in st<strong>and</strong>ardized<br />
units that can be meaningfully compared. <strong>The</strong> larger the st<strong>and</strong>ard deviation<br />
for any dataset, the more the data are spread out from the mean. <strong>The</strong> smaller<br />
the st<strong>and</strong>ard deviation, the more tightly are the individual data points<br />
clustered around the mean.<br />
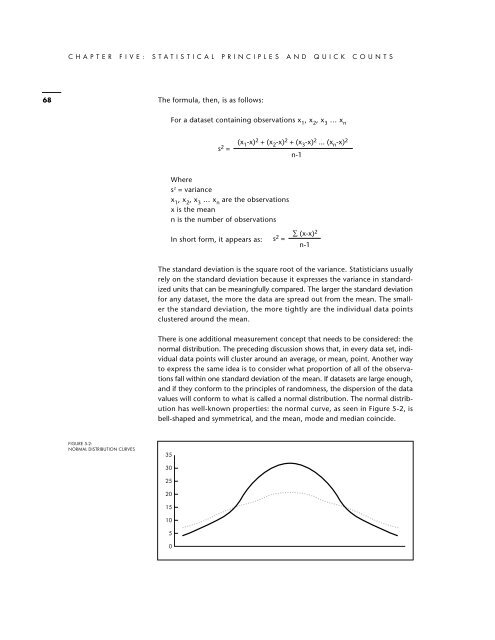
<strong>The</strong>re is one additional measurement concept that needs to be considered: the<br />
normal distribution. <strong>The</strong> preceding discussion shows that, in every data set, individual<br />
data points will cluster around an average, or mean, point. Another way<br />
to express the same idea is to consider what proportion of all of the observations<br />
fall within one st<strong>and</strong>ard deviation of the mean. If datasets are large enough,<br />
<strong>and</strong> if they conform to the principles of r<strong>and</strong>omness, the dispersion of the data<br />
values will conform to what is called a normal distribution. <strong>The</strong> normal distribution<br />
has well-known properties: the normal curve, as seen in Figure 5-2, is<br />
bell-shaped <strong>and</strong> symmetrical, <strong>and</strong> the mean, mode <strong>and</strong> median coincide.<br />
FIGURE 5-2:<br />
NORMAL DISTRIBUTION CURVES<br />
35<br />
30<br />
25<br />
20<br />
15<br />
10<br />
5<br />
0