

The Quick Count and Election Observation
The Quick Count and Election Observation
The Quick Count and Election Observation

You also want an ePaper? Increase the reach of your titles
YUMPU automatically turns print PDFs into web optimized ePapers that Google loves.
THE QUICK COUNT AND ELECTION OBSERVATION<br />
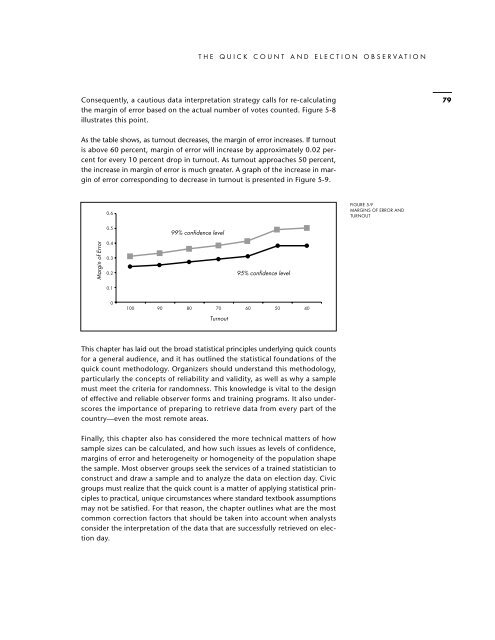
Consequently, a cautious data interpretation strategy calls for re-calculating<br />
the margin of error based on the actual number of votes counted. Figure 5-8<br />
illustrates this point.<br />
79<br />
As the table shows, as turnout decreases, the margin of error increases. If turnout<br />
is above 60 percent, margin of error will increase by approximately 0.02 percent<br />
for every 10 percent drop in turnout. As turnout approaches 50 percent,<br />
the increase in margin of error is much greater. A graph of the increase in margin<br />
of error corresponding to decrease in turnout is presented in Figure 5-9.<br />
0.6<br />
FIGURE 5-9<br />
MARGINS OF ERROR AND<br />
TURNOUT<br />
0.5<br />
99% confidence level<br />
Margin of Error<br />
0.4<br />
0.3<br />
0.2<br />
95% confidence level<br />
0.1<br />
0<br />
100 90 80 70 60 50 40<br />
Turnout<br />
This chapter has laid out the broad statistical principles underlying quick counts<br />
for a general audience, <strong>and</strong> it has outlined the statistical foundations of the<br />
quick count methodology. Organizers should underst<strong>and</strong> this methodology,<br />
particularly the concepts of reliability <strong>and</strong> validity, as well as why a sample<br />
must meet the criteria for r<strong>and</strong>omness. This knowledge is vital to the design<br />
of effective <strong>and</strong> reliable observer forms <strong>and</strong> training programs. It also underscores<br />
the importance of preparing to retrieve data from every part of the<br />
country—even the most remote areas.<br />
Finally, this chapter also has considered the more technical matters of how<br />
sample sizes can be calculated, <strong>and</strong> how such issues as levels of confidence,<br />
margins of error <strong>and</strong> heterogeneity or homogeneity of the population shape<br />
the sample. Most observer groups seek the services of a trained statistician to<br />
construct <strong>and</strong> draw a sample <strong>and</strong> to analyze the data on election day. Civic<br />
groups must realize that the quick count is a matter of applying statistical principles<br />
to practical, unique circumstances where st<strong>and</strong>ard textbook assumptions<br />
may not be satisfied. For that reason, the chapter outlines what are the most<br />
common correction factors that should be taken into account when analysts<br />
consider the interpretation of the data that are successfully retrieved on election<br />
day.