

The Quick Count and Election Observation
The Quick Count and Election Observation
The Quick Count and Election Observation

You also want an ePaper? Increase the reach of your titles
YUMPU automatically turns print PDFs into web optimized ePapers that Google loves.
CHAPTER FIVE: STATISTICAL PRINCIPLES AND QUICK COUNTS<br />
72 domly selected set of sample points within a strata, the observer group can<br />
generalize the results of the observation to the entire strata that the observer<br />
group covers.<br />
Since most populations seem to be stratified when it comes to<br />
the vote, why not use stratified samples as a matter of practice?<br />
<strong>The</strong> stratification approach seems to be an ideal, but there are two reasons<br />
why it may not be appropriate. First, if quick counts are using conservative<br />
assumptions about margins of error <strong>and</strong> confidence intervals, then the sample<br />
is likely to be large. And, because of probability theory, it is clear that large<br />
samples will end up producing accurate replicas of the total population even<br />
without stratification. Second, stratification assumes reliable information about<br />
how citizens tend to vote within the strata. Around what lines, exactly, should<br />
the stratification criteria be drawn? In many countries, the information needed<br />
to make that judgement may not be very reliable. Previous elections cannot be<br />
a reliable guide, especially if their results were questionable. <strong>The</strong> stronger strategy<br />
is to refer to strata post facto, that is, to check the distribution of cases<br />
drawn from a general r<strong>and</strong>om sample against strata within the population after<br />
the sample is drawn. So, if 40 percent of the voting population lives in the capital<br />
city of a country, then 40 percent of the r<strong>and</strong>omly drawn sample points<br />
should end up being from the capital city.<br />
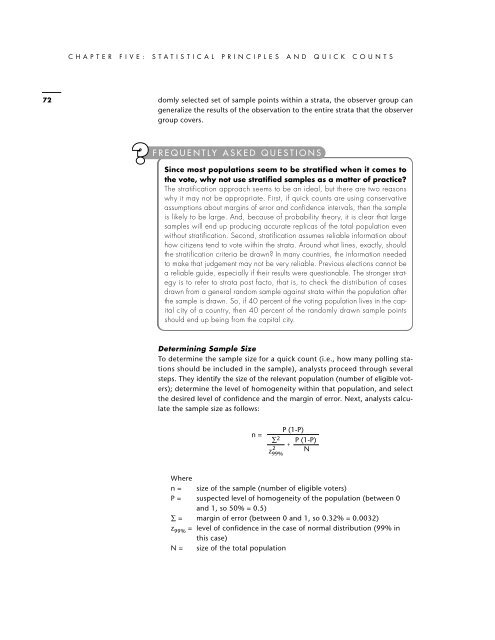
Determining Sample Size<br />
To determine the sample size for a quick count (i.e., how many polling stations<br />
should be included in the sample), analysts proceed through several<br />
steps. <strong>The</strong>y identify the size of the relevant population (number of eligible voters);<br />
determine the level of homogeneity within that population, <strong>and</strong> select<br />
the desired level of confidence <strong>and</strong> the margin of error. Next, analysts calculate<br />
the sample size as follows:<br />
n =<br />
∑ 2<br />
2<br />
z 99%<br />
P (1-P)<br />
P (1-P)<br />
+<br />
N<br />
Where<br />
n = size of the sample (number of eligible voters)<br />
P = suspected level of homogeneity of the population (between 0<br />
<strong>and</strong> 1, so 50% = 0.5)<br />
∑ = margin of error (between 0 <strong>and</strong> 1, so 0.32% = 0.0032)<br />
z 99%<br />
= level of confidence in the case of normal distribution (99% in<br />
this case)<br />
N = size of the total population