

SFPUC Wholesale Customer Water Demand Projections ... - BAWSCA
SFPUC Wholesale Customer Water Demand Projections ... - BAWSCA
SFPUC Wholesale Customer Water Demand Projections ... - BAWSCA

Create successful ePaper yourself
Turn your PDF publications into a flip-book with our unique Google optimized e-Paper software.
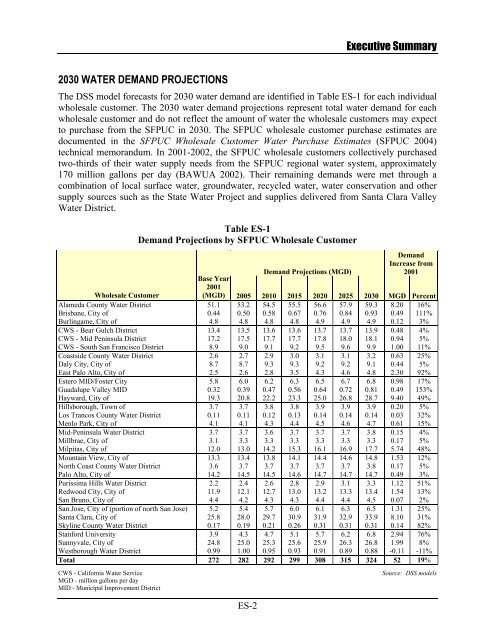
Executive Summary<br />
2030 WATER DEMAND PROJECTIONS<br />
The DSS model forecasts for 2030 water demand are identified in Table ES-1 for each individual<br />
wholesale customer. The 2030 water demand projections represent total water demand for each<br />
wholesale customer and do not reflect the amount of water the wholesale customers may expect<br />
to purchase from the <strong>SFPUC</strong> in 2030. The <strong>SFPUC</strong> wholesale customer purchase estimates are<br />
documented in the <strong>SFPUC</strong> <strong>Wholesale</strong> <strong>Customer</strong> <strong>Water</strong> Purchase Estimates (<strong>SFPUC</strong> 2004)<br />
technical memorandum. In 2001-2002, the <strong>SFPUC</strong> wholesale customers collectively purchased<br />
two-thirds of their water supply needs from the <strong>SFPUC</strong> regional water system, approximately<br />
170 million gallons per day (BAWUA 2002). Their remaining demands were met through a<br />
combination of local surface water, groundwater, recycled water, water conservation and other<br />
supply sources such as the State <strong>Water</strong> Project and supplies delivered from Santa Clara Valley<br />
<strong>Water</strong> District.<br />
Table ES-1<br />
<strong>Demand</strong> <strong>Projections</strong> by <strong>SFPUC</strong> <strong>Wholesale</strong> <strong>Customer</strong><br />
ES-2<br />
<strong>Demand</strong><br />
Increase from<br />
2001<br />
<strong>Demand</strong> <strong>Projections</strong> (MGD)<br />
Base Year<br />
2001<br />
(MGD) 2005 2010 2015 2020 2025 2030 MGD Percent<br />
<strong>Wholesale</strong> <strong>Customer</strong><br />
Alameda County <strong>Water</strong> District 51.1 53.2 54.5 55.5 56.6 57.9 59.3 8.20 16%<br />
Brisbane, City of 0.44 0.50 0.58 0.67 0.76 0.84 0.93 0.49 111%<br />
Burlingame, City of 4.8 4.8 4.8 4.8 4.9 4.9 4.9 0.12 3%<br />
CWS - Bear Gulch District 13.4 13.5 13.6 13.6 13.7 13.7 13.9 0.48 4%<br />
CWS - Mid Peninsula District 17.2 17.5 17.7 17.7 17.8 18.0 18.1 0.94 5%<br />
CWS - South San Francisco District 8.9 9.0 9.1 9.2 9.5 9.6 9.9 1.00 11%<br />
Coastside County <strong>Water</strong> District 2.6 2.7 2.9 3.0 3.1 3.1 3.2 0.63 25%<br />
Daly City, City of 8.7 8.7 9.3 9.3 9.2 9.2 9.1 0.44 5%<br />
East Palo Alto, City of 2.5 2.6 2.8 3.5 4.3 4.6 4.8 2.30 92%<br />
Estero MID/Foster City 5.8 6.0 6.2 6.3 6.5 6.7 6.8 0.98 17%<br />
Guadalupe Valley MID 0.32 0.39 0.47 0.56 0.64 0.72 0.81 0.49 153%<br />
Hayward, City of 19.3 20.8 22.2 23.3 25.0 26.8 28.7 9.40 49%<br />
Hillsborough, Town of 3.7 3.7 3.8 3.8 3.9 3.9 3.9 0.20 5%<br />
Los Trancos County <strong>Water</strong> District 0.11 0.11 0.12 0.13 0.14 0.14 0.14 0.03 32%<br />
Menlo Park, City of 4.1 4.1 4.3 4.4 4.5 4.6 4.7 0.61 15%<br />
Mid-Peninsula <strong>Water</strong> District 3.7 3.7 3.6 3.7 3.7 3.7 3.8 0.15 4%<br />
Millbrae, City of 3.1 3.3 3.3 3.3 3.3 3.3 3.3 0.17 5%<br />
Milpitas, City of 12.0 13.0 14.2 15.3 16.1 16.9 17.7 5.74 48%<br />
Mountain View, City of 13.3 13.4 13.8 14.1 14.4 14.6 14.8 1.53 12%<br />
North Coast County <strong>Water</strong> District 3.6 3.7 3.7 3.7 3.7 3.7 3.8 0.17 5%<br />
Palo Alto, City of 14.2 14.5 14.5 14.6 14.7 14.7 14.7 0.49 3%<br />
Purissima Hills <strong>Water</strong> District 2.2 2.4 2.6 2.8 2.9 3.1 3.3 1.12 51%<br />
Redwood City, City of 11.9 12.1 12.7 13.0 13.2 13.3 13.4 1.54 13%<br />
San Bruno, City of 4.4 4.2 4.3 4.3 4.4 4.4 4.5 0.07 2%<br />
San Jose, City of (portion of north San Jose) 5.2 5.4 5.7 6.0 6.1 6.3 6.5 1.31 25%<br />
Santa Clara, City of 25.8 28.0 29.7 30.9 31.9 32.9 33.9 8.10 31%<br />
Skyline County <strong>Water</strong> District 0.17 0.19 0.21 0.26 0.31 0.31 0.31 0.14 82%<br />
Stanford University 3.9 4.3 4.7 5.1 5.7 6.2 6.8 2.94 76%<br />
Sunnyvale, City of 24.8 25.0 25.3 25.6 25.9 26.3 26.8 1.99 8%<br />
Westborough <strong>Water</strong> District 0.99 1.00 0.95 0.93 0.91 0.89 0.88 -0.11 -11%<br />
Total 272 282 292 299 308 315 324 52 19%<br />
CWS - California <strong>Water</strong> Service<br />
MGD - million gallons per day<br />
MID - Municipal Improvement District<br />
Source: DSS models


