

SFPUC Wholesale Customer Water Demand Projections ... - BAWSCA
SFPUC Wholesale Customer Water Demand Projections ... - BAWSCA
SFPUC Wholesale Customer Water Demand Projections ... - BAWSCA

You also want an ePaper? Increase the reach of your titles
YUMPU automatically turns print PDFs into web optimized ePapers that Google loves.
Single Family<br />
Multifamily<br />
Commercial<br />
Industrial<br />
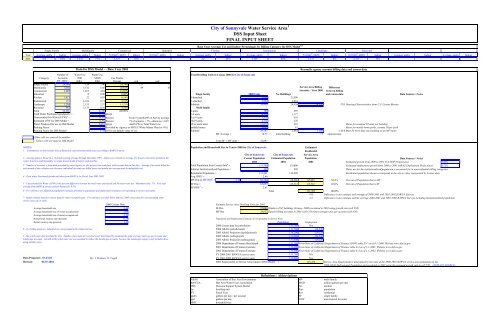
City of Sunnyvale <strong>Water</strong> Service Area 1<br />
DSS Input Sheet<br />
FINAL INPUT SHEET<br />
Base Year Average Use and Indoor Percentages by Billing Category for DSS Model 2,9<br />
Fireline<br />
Year Average, gpd/a Indoor Average, gpd/a Indoor Average 8 , gpd/a Indoor Average 8 , gpd/a Indoor Average, gpd/a Indoor Average, gpd/a Indoor Average 9 , gpd/a Indoor Average 9 , gpd/a Indoor Average, gpd/a Indoor Average, gpd/a Indoor<br />
2001 324 64% 3,532 77% 1,675 76% 22 24% 4,169 43% 2,133 0% 2,133 0%<br />
Institutional<br />
Landscape<br />
Recycled<br />
Data for DSS Model - - Base Year 2001<br />
Number of <strong>Water</strong> Use <strong>Water</strong> Use,<br />
Total Dwelling Units in Census 2000 for City of Sunnyvale<br />
Category Accounts 2001 MGD Use Profile<br />
FY. 2001 3 gpd/a 2 2001 Percent gcd gcd<br />
Single Family 24,564 324 7.96 34.74% 121 77<br />
Multifamily 1,661 3,532 5.86 25.61% 89 69<br />
Service Area Billing<br />
Commercial 2,880 1,675 4.83 21.07%<br />
Accounts - Year 2000<br />
Industrial 0 0.00 0.00%<br />
Single family<br />
2000 Units<br />
No. Buildings<br />
3<br />
Fireline 1,413 22 0.03 0.14% 1-detached 21,006 21,006<br />
Institutional 171 4,169 0.71 3.11% 1-attached 3,924 3,924<br />
Landscape 1,204 2,133 2.57 11.21% Subtotal 24,930 24,930 24,147 -783<br />
Recycled 445 2,133 0.95 4.14% Multi family<br />
Total 32,336 22.90 100.00% 2-units 789 395<br />
Total <strong>Water</strong> Purchased (produced) 4 = 22.24 MGD 3-4 units 4,119 1,177<br />
Unaccounted For <strong>Water</strong> (UFW) 5 = 8.3% Percent From 5 year BAWUA Survey average 5 to 9 units 3,571 510<br />
Estimated UFW for DSS Model = 8.3% Percent 7% if actual is < 7%, otherwise = E25 10-19 units 4,171 278<br />
<strong>Water</strong> Produced for use in DSS Model 24.81 MGD Add UFW to Total <strong>Water</strong> Use 20 or more units 12,077 242<br />
Peaking Factor 1.75 Provided by Agency or <strong>SFPUC</strong> <strong>Water</strong> Master Plan (or NA) mobile homes 4,040 81<br />
Peaking Factor for DSS Model= 1.75 If NA use default value of 1.6. Subtotal 28,767 2,682 1,668 -1,014<br />
MF Average = 10.73 units/building 17 units/account<br />
- Blue cells are entered by modeler<br />
- Yellow cells are input to DSS Model Total SF + MF units = 53,697<br />
NOTES<br />
1. - Communities served includes City of Sunnyvale and unincorporated areas according to BAWUA survey<br />
Population and Household Size in Census 2000 forCity of Sunnyvale Estimated<br />
Residential<br />
City of Sunnyvale City of Sunnyvale Service Area<br />
Census Population Estimated Population Population<br />
2 - Average gpd/a is based on a 12-month moving average through December 2001. Indoor use is based on average of 2 lowest consecutive months in the<br />
winter if meters read bimonthly, or single lowest month if meters read monthly.<br />
3 - Number of accounts is from data provided by water agency for this project (see worksheet with account data in this file). Average of accounts billed for<br />
each month of the calendar year (because individual accounts are billed every two months the average must be multiplied two).<br />
4 - Total water Purchased (produced) taken from BAWUA for Fiscal Year 2001-2002.<br />
5 - Unaccounted for <strong>Water</strong> (UFW) is the percent difference between the total water purchased and the total water use. Minimum value: 7%. Five-year<br />
average from BAWUA survey used for Sunnyvale: 8.3%.<br />
6 - For reference see additional population estimates provided in population and employment estimates corresponding to service area table.<br />
7 - Initial estimate based on census data for renter occupied units. For reference see table below that has 2000 census data for corresponding water<br />
service area city or cities.<br />
Reconcile agency account billing data and census data<br />
Data Sources / Notes<br />
2000 2001 2001 Estimated growth from 2000 to 2001 (CA DOF <strong>Projections</strong>): 0.64%<br />
Total Population from Census data 6 = 131,760 132600 Estimated employment growth from 2000 to 2001 (ABAG Employment <strong>Projections</strong>): 0.75%<br />
Subtract Institutionalized Population = 499 502 <strong>Water</strong> use for the institutionalized population is accounted for in nonresidential billing categories<br />
Residential Population = 131,261 132,098 Residential population shown corresponds to the city or cities represented by Census data<br />
Avg. HHS 7 = 2.44<br />
MF Pop @ MF HHS 7 = 2.30 66,164 66,586 65,853 50.4% Percent of Population that is MF<br />
SF Pop = 65,097 65,512 65,512 49.6% Percent of Population that is SF<br />
SF HHS 7 = 2.61<br />
Total 131,365 100.0%<br />
-515 Difference in our estimate and average of 2000-2001 and 2001-2002 BAWUA Surveys<br />
-12 Difference in our estimate and the average 2000-2001 and 2001-2002 BAWUA Surveys including institutionalized population<br />
2000 Census Data Estimate Service Area Dwelling Units for 2001<br />
Average household size 2.49 SF Res 25,089 Number of SF buildings (Census, 2000) escalated to 2001 using growth rate (cell T38)<br />
Average household size of owner-occupied unit 2.60 MF Res 28,632 Equals billing accounts in 2001 (cell C16) times average units per account (cell N30)<br />
Average household size of renter-occupied unit 2.39<br />
Homeowner vacancy rate (percent) 0.50 Population and Employment Estimates Corresponding to Service Area<br />
Rental vacancy rate (percent) 1.30 Population Employment<br />
8 - For billing purposes, industrial use was grouped with commercial use.<br />
9 - Recycled water data provided by City. Number of accounts for recycled water determined by assuming the same average water use per account and<br />
Landscape accounts. Growth in Recycled water use was assumed to reduce the Landscape accounts, because the Landscape category only includes those<br />
using potable water.<br />
Data Sources / Notes<br />
2000 Census data for jurisdiction 131,760 NA<br />
2000 ABAG (jurisdictional) 131,760 124,540<br />
2005 ABAG Projection (jurisdictional) 136,200 129,220<br />
2000 ABAG (subregional) 133,086 124,540<br />
2005 ABAG Projection (subregional) 137,000 129,220<br />
2000 Department of Finance Benchmark 131,760 From State of California Department of Finance (DOF) table E-4 as of 4-1-2000. Website www.dof.ca.gov<br />
2001 Department of Finance Estimate 132,600 From State of California Department of Finance table E-4 as of 1-1-2001. Website www.dof.ca.gov<br />
2002 Department of Finance Estimate 132,600 From State of California Department of Finance table E-4 as of 1-1-2002. Website www.dof.ca.gov<br />
FY 2000-2001 BAWUA service area 131,760 NA<br />
Data Prepared : 07-23-03 By: J. Hudson, N. Foged FY 2001-2002 BAWUA service area 132,000 NA<br />
Revised: 06-07-2004 2001 Employment in Service Area (input to DSS Model) = 125,476 Service Area Employment is determined by the ratio of the 2000-2001 BAWUA service area population to the<br />
2000 ABAG Subregional Population and escalated to 2001 using the assumed growth rate in cell T39. (EXPLAIN SOURCE)<br />
Difference<br />
between billing<br />
and census data<br />
Housing Characteristics from U.S. Census Bureau<br />
Meter for assumed 50 units per building<br />
Meter for mobile home parks, assume 50 per park<br />
Must be more than one building on an MF meter.<br />
Definitions / Abbreviations<br />
ABAG Association of Bay Area Governments MF multi family<br />
BAWUA Bay Area <strong>Water</strong> Users Association MGD million gallons per day<br />
DSS Decision Support System Model No. number<br />
du dwelling unit Pop population<br />
FY Fiscal Year Res residential<br />
gpd/a gallons per day / per account SF single family<br />
gpd gallons per day UFW unaccounted for water<br />
HHS<br />
household size


