

SFPUC Wholesale Customer Water Demand Projections ... - BAWSCA
SFPUC Wholesale Customer Water Demand Projections ... - BAWSCA
SFPUC Wholesale Customer Water Demand Projections ... - BAWSCA

Create successful ePaper yourself
Turn your PDF publications into a flip-book with our unique Google optimized e-Paper software.
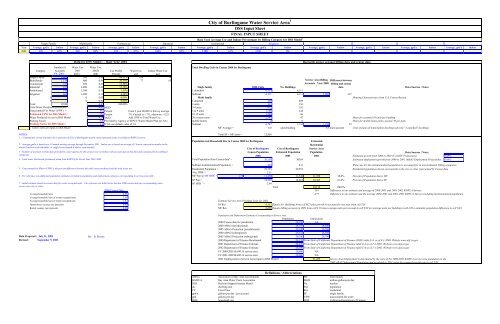
City of Burlingame <strong>Water</strong> Service Area 1<br />
DSS Input Sheet<br />
FINAL INPUT SHEET<br />
Base Year Average Use and Indoor Percentages by Billing Category for DSS Model 2<br />
Single Family<br />
Multifamily<br />
Commercial<br />
Industrial<br />
Institutional<br />
Irrigation<br />
Year Average, gpd/a Indoor Average, gpd/a Indoor Average, gpd/a Indoor Average, gpd/a Indoor Average, gpd/a Indoor Average, gpd/a Indoor Average, gpd/a Indoor Average, gpd/a Indoor Average, gpd/a Indoor Average, gpd/a Indoor<br />
2001 300 65% 800 84% 850 97% 2400 82% 1100 61% 1200 0%<br />
Data for DSS Model - - Base Year 2001<br />
Estimated<br />
Residential<br />
City of Burlingame City of Burlingame Service Area<br />
Census Population Estimated Population Population<br />
Reconcile agency account billing data and census data<br />
Number of <strong>Water</strong> Use <strong>Water</strong> Use,<br />
Total Dwelling Units in Census 2000 for Burlingame<br />
Category Accounts 2001 MGD Use Profile <strong>Water</strong> Use Indoor <strong>Water</strong> Use<br />
FY. 2001 3 gpd/a 2 2001 Percent gcd gcd<br />
Single Family 6,600 300 1.98 44.33% 108 70<br />
Multifamily 1,138 800 0.91 20.39% 77 65<br />
Service Area Billing Difference between<br />
Commercial 713 850 0.61 13.58%<br />
Accounts - Year 2000 billing and census<br />
Industrial 257 2,400 0.62 13.78%<br />
Single family<br />
2000 Units<br />
No. Buildings<br />
3<br />
data<br />
Data Sources / Notes<br />
Institutional 146 1,100 0.16 3.59% 1-detached 6,111 6,111<br />
Irrigation 162 1,200 0.19 4.34% Subtotal 6,111 6,111 5,985 -127<br />
0 0 0.00 0.00% Multi family<br />
Housing Characteristics from U.S. Census Bureau<br />
0 0 0.00 0.00% 1-attached 409 409<br />
Total 9,016 4.47 100.00% 2-units 311 156<br />
Total <strong>Water</strong> Purchased (produced) 4 = 4.63 MGD 3-4 units 672 192<br />
Unaccounted For <strong>Water</strong> (UFW) 5 = 5% Percent From 5 year BAWUA Survey average 5 to 9 units 1,705 244<br />
Estimated UFW for DSS Model = 7% Percent 7% if actual is < 7%, otherwise = E25 10-19 units 1,288 86<br />
<strong>Water</strong> Produced for use in DSS Model 4.78 MGD Add UFW to Total <strong>Water</strong> Use 20 or more units 2,362 47<br />
Meter for assumed 50 units per building<br />
Peaking Factor NA Provided by Agency or <strong>SFPUC</strong> <strong>Water</strong> Master Plan (or NA) mobile homes 0 0<br />
Meter for mobile home parks, assume 50 per park<br />
Peaking Factor for DSS Model= 1.6 If NA use default value of 1.6. Subtotal 6,747 1,133 1,159 25<br />
- Yellow cells are input to DSS Model MF Average = 6.0 units/building 5.8 units/account Units include all multi-family dwellings plus the "1-attached" dwellings.<br />
NOTES Total SF + MF units = 12,858<br />
1. - Communities served (includes all or portions of) City of Burlingame nearby unincorporated areas according to BAWUA survey<br />
Population and Household Size in Census 2000 for Burlingame<br />
2 - Average gpd/a is based on a 12-month moving average through December 2001. Indoor use is based on average of 2 lowest consecutive months in the<br />
winter if meters read bimonthly, or single lowest month if meters read monthly.<br />
3 - Number of accounts is from data provided by water agency for this project (see worksheet with account data in this file) and calculated from combined<br />
categories<br />
4 - Total water Purchased (produced) taken from BAWUA for Fiscal Year 2001-2002.<br />
5 - Unaccounted for <strong>Water</strong> (UFW) is the percent difference between the total water purchased and the total water use.<br />
6 - For reference see additional population estimates provided in population and employment estimates corresponding to service area table.<br />
Data Sources / Notes<br />
2000 2001 2001 Estimated growth from 2000 to 2001 (CA DOF <strong>Projections</strong>): 0.68%<br />
Total Population from Census data 6 = 30,158 30364 Estimated employment growth from 2000 to 2001 (ABAG Employment <strong>Projections</strong>): 0.84%<br />
Subtract Institutionalized Population = 428 431 <strong>Water</strong> use for the institutionalized population is accounted for in nonresidential billing categories<br />
Residential Population = 29,730 29,933 Residential population shown corresponds to the city or cities represented by Census data<br />
Avg. HHS 7 = 2.31<br />
MF Pop @ MF HHS 7 = 1.70 11,470 11,548 11,769 38.6% Percent of Population that is MF<br />
SF Pop = 18,260 18,385 18,385 61.4% Percent of Population that is SF<br />
7 - Initial estimate based on census data for renter occupied units. For reference see table below that has 2000 census data for corresponding water<br />
SF HHS 7 = 2.99<br />
service area city or cities.<br />
Total 30,154 100.0%<br />
2000 Census Data 154 Difference in our estimate and average of 2000-2001 and 2001-2002 BAWUA Surveys<br />
Average household size 2.21 -277 Difference in our estimate and the average 2000-2001 and 2001-2002 BAWUA Surveys including institutionalized population<br />
Average household size of owner-occupied unit 2.58<br />
Average household size of renter-occupied unit 1.87 Estimate Service Area Dwelling Units for 2001<br />
Homeowner vacancy rate (percent) 0.40 SF Res 6,153 Equals No. Buildings from cell M21 plus growth in accounts for one year from cell T38<br />
Rental vacancy rate (percent) 2.20 MF Res 6,629 Equals billing accounts in 2001 from cell C16 times average units per account in cell N30 (or average units per building in cell L30 to minimize population difference in cell N47)<br />
Population and Employment Estimates Corresponding to Service Area<br />
Population<br />
Employment<br />
2000 Census data for jurisdiction 30,158 NA<br />
2000 ABAG (jurisdictional) 28,158 28,580<br />
2005 ABAG Projection (jurisdictional) 29,100 29,780<br />
2000 ABAG (subregional) 29,354 28,580<br />
Data Prepared : July 31, 2003 By: B. Skeens 2005 ABAG Projection (subregional) 30,300 29,780<br />
Revised: September 5, 2003 2000 Department of Finance Benchmark 28,158 From State of California Department of Finance (DOF) table E-4 as of 4-1-2000. Website www.dof.ca.gov<br />
2001 Department of Finance Estimate 28,350 From State of California Department of Finance table E-4 as of 1-1-2001. Website www.dof.ca.gov<br />
2002 Department of Finance Estimate 28,300 From State of California Department of Finance table E-4 as of 1-1-2002. Website www.dof.ca.gov<br />
FY 2000-2001 BAWUA service area 30,000 NA<br />
FY 2001-2002 BAWUA service area 30,000 NA<br />
2001 Employment in Service Area (input to DSS Model) = 31,205 Service Area Employment is determined by the ratio of the 2000-2001 BAWUA service area population to the<br />
2000 ABAG Subregional Population and escalated to 2001 using the assumed growth rate in cell T39.<br />
Definitions / Abbreviations<br />
ABAG Association of Bay Area Governments MF multi family<br />
BAWUA Bay Area <strong>Water</strong> Users Association MGD million gallons per day<br />
DSS Decision Support System Model No. number<br />
du dwelling unit Pop population<br />
FY Fiscal Year Res residential<br />
gpd/a gallons per day / per account SF single family<br />
gpd gallons per day UFW unaccounted for water<br />
HHS household size DOF California Department of Finance


