

SFPUC Wholesale Customer Water Demand Projections ... - BAWSCA
SFPUC Wholesale Customer Water Demand Projections ... - BAWSCA
SFPUC Wholesale Customer Water Demand Projections ... - BAWSCA

You also want an ePaper? Increase the reach of your titles
YUMPU automatically turns print PDFs into web optimized ePapers that Google loves.
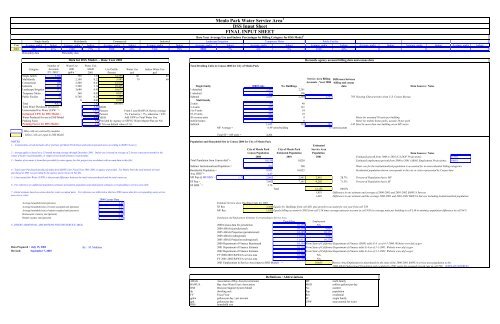
Base Year Average Use and Indoor Percentages by Billing Category for DSS Model 2<br />
Single family<br />
Multifamily<br />
Commercial<br />
Industrial<br />
Landscape/Irrigation<br />
Temporary Meter<br />
Public Facility<br />
Year Average, gpd/a Indoor Average, gpd/a Indoor Average, gpd/a Indoor Average, gpd/a Indoor Average, gpd/a Indoor Average, gpd/a Indoor Average, gpd/a Indoor Average, gpd/a Indoor Average, gpd/a Indoor Average, gpd/a Indoor<br />
2001 390 61% 2100 77% 2500 66% 5300 78% 3680 7% 360 5% 8740 41%<br />
Bimonthly data<br />
Bimonthly data<br />
Data for DSS Model - - Base Year 2001<br />
Menlo Park <strong>Water</strong> Service Area 1<br />
DSS Input Sheet<br />
FINAL INPUT SHEET<br />
Number of <strong>Water</strong> Use <strong>Water</strong> Use,<br />
Total Dwelling Units in Census 2000 for City of Menlo Park<br />
Category Accounts 2001 MGD Use Profile <strong>Water</strong> Use Indoor <strong>Water</strong> Use<br />
FY. 2001 3 gpd/a 2 2001 Percent gcd gcd<br />
Single family 3,366 390 1.31 34.35% 141 85<br />
Multifamily 107 2,100 0.22 5.88% 79 60<br />
Commercial 188 2,500 0.47 12.27%<br />
Industrial 212 5,300 1.12 29.42%<br />
Single family<br />
2000 Units<br />
No. Buildings<br />
Landscape/Irrigation 111 3,680 0.41 10.67% 1-detached 2,261 2,261<br />
Tempoary Meter 6 360 0.00 0.05% 1-attached 308 308<br />
Reconcile agency account billing data and census data<br />
Service Area Billing<br />
Accounts - Year 2000<br />
3<br />
Difference between<br />
billing and census<br />
data<br />
Public Facility 32 8,740 0.28 7.36% Subtotal 2,569 2,569 3,354 785<br />
0 0 0.00 0.00% Multi family<br />
Total 4,021 3.82 100.00% 2-units 95 48<br />
Total <strong>Water</strong> Purchased (produced) 4 = 3.53 MGD 3-4 units 425 121<br />
Unaccounted For <strong>Water</strong> (UFW) 5 = 1.8% Percent From 5 year BAWUA Survey average 5 to 9 units 381 54<br />
Estimated UFW for DSS Model = 7% Percent 7% if actual is < 7%, otherwise = E25 10-19 units 291 19<br />
<strong>Water</strong> Produced for use in DSS Model 4.09 MGD Add UFW to Total <strong>Water</strong> Use 20 or more units 440 9<br />
Peaking Factor NA Provided by Agency or <strong>SFPUC</strong> <strong>Water</strong> Master Plan (or NA) mobile homes 2 0<br />
Peaking Factor for DSS Model= 1.6 If NA use default value of 1.6. Subtotal 1,635 252 107 -145<br />
MF Average = 6.49 units/building 15 units/account<br />
- Blue cells are entered by modeler<br />
- Yellow cells are input to DSS Model Total SF + MF units = 4,204<br />
Housing Characteristics from U.S. Census Bureau<br />
Meter for assumed 50 units per building<br />
Meter for mobile home parks, assume 50 per park<br />
Must be more than one building on an MF meter.<br />
Data Sources / Notes<br />
NOTES<br />
1. - Communities served (includes all or portions of) Menlo Park (East) and unincorporated areas according to BAWUA survey<br />
2 - Average gpd/a is based on a 12-month moving average through December 2001. Indoor use is based on average of 2 lowest consecutive months in the<br />
winter if meters read bimonthly, or single lowest month if meters read monthly.<br />
3 - Number of accounts is from data provided by water agency for this project (see worksheet with account data in this file)<br />
Population and Household Size in Census 2000 for City of Menlo Park<br />
Estimated<br />
City of Menlo Park City of Menlo Park Service Area<br />
Census Population Estimated Population Population<br />
Data Sources / Notes<br />
2000 2001 2001 Estimated growth from 2000 to 2001 (CA DOF <strong>Projections</strong>): 0.70%<br />
Total Population from Census data 6 = 10,159 10230 Estimated employment growth from 2000 to 2001 (ABAG Employment <strong>Projections</strong>): 0.66%<br />
Subtract Institutionalized Population = 206 208 <strong>Water</strong> use for the institutionalized population is accounted for in nonresidential billing categories<br />
4 - Total water Purchased (produced) taken from BAWUA for Fiscal Year 2001-2002 or agency if provided. For Menlo Park the total amount of water<br />
Residential Population = 9,953 10,022 Residential population shown corresponds to the city or cities represented by Census data<br />
purchased in 2001 was provided by the agency and is shown in this file.<br />
Avg. HHS 7 = 2.37<br />
5 - Unaccounted for <strong>Water</strong> (UFW) is the percent difference between the total water purchased and the total water use.<br />
MF Pop @ MF HHS 7 = 1.75 2,861 2,881 2,861 28.7% Percent of Population that is MF<br />
SF Pop = 7,092 7,141 9,292 71.3% Percent of Population that is SF<br />
6 - For reference see additional population estimates provided in population and employment estimates corresponding to service area table.<br />
SF HHS 7 = 2.76<br />
Total 12,153 100.0%<br />
7 - Initial estimate based on census data for renter occupied units. For reference see table below that has 2000 census data for corresponding water service<br />
1,853 Difference in our estimate and average of 2000-2001 and 2001-2002 BAWUA Surveys<br />
area city or cities.<br />
1,645 Difference in our estimate and the average 2000-2001 and 2001-2002 BAWUA Surveys including institutionalized population<br />
2000 Census Data<br />
Average household size (persons) 2.41 Estimate Service Area Dwelling Units for 2001<br />
Average household size of owner-occupied unit (persons) 2.67 SF Res 3,366 Equals No. Buildings from cell M21 plus growth in accounts for one year from cell T38<br />
Average household size of renter-occupied unit (persons) 2.07 MF Res 1,635 Equals billing accounts in 2001 from cell C16 times average units per account in cell N30 (or average units per building in cell L30 to minimize population difference in cell N47)<br />
Homeowner vacancy rate (percent) 0.30<br />
Rental vacancy rate (percent) 1.50 Population and Employment Estimates Corresponding to Service Area<br />
Population<br />
Employment<br />
8 -(INSERT ADDITIONAL ASSUMPTIONS FOR THIS SERVICE AREA)<br />
2000 Census data for jurisdiction 10,159 NA<br />
2000 ABAG (jurisdictional) 10,159 9,851<br />
2005 ABAG Projection (jurisdictional) 10,395 10,177<br />
2000 ABAG (subregional) 11,634 9,950<br />
2005 ABAG Projection (subregional) 11,913 10,276<br />
2000 Department of Finance Benchmark 10,159 From State of California Department of Finance (DOF) table E-4 as of 4-1-2000. Website www.dof.ca.gov<br />
Data Prepared : July 15, 2003 By: M. Maddaus 2001 Department of Finance Estimate 10,230 From State of California Department of Finance table E-4 as of 1-1-2001. Website www.dof.ca.gov<br />
Revised: September 7, 2003 2002 Department of Finance Estimate 10,214 From State of California Department of Finance table E-4 as of 1-1-2002. Website www.dof.ca.gov<br />
FY 2000-2001 BAWUA service area 10,300 NA<br />
FY 2001-2002 BAWUA service area 10,300 NA<br />
2001 Employment in Service Area (input to DSS Model) = 10,053 Service Area Employment is determined by the ratio of the 2000-2001 BAWUA service area population to the<br />
2000 ABAG Subregional Population and escalated to 2001 using the assumed growth rate in cell T39. (EXPLAIN SOURCE)<br />
Definitions / Abbreviations<br />
ABAG Association of Bay Area Governments MF multi family<br />
BAWUA Bay Area <strong>Water</strong> Users Association MGD million gallons per day<br />
DSS Decision Support System Model No. number<br />
du dwelling unit Pop population<br />
FY Fiscal Year Res residential<br />
gpd/a gallons per day / per account SF single family<br />
gpd gallons per day UFW unaccounted for water<br />
HHS<br />
household size


