

SFPUC Wholesale Customer Water Demand Projections ... - BAWSCA
SFPUC Wholesale Customer Water Demand Projections ... - BAWSCA
SFPUC Wholesale Customer Water Demand Projections ... - BAWSCA

Create successful ePaper yourself
Turn your PDF publications into a flip-book with our unique Google optimized e-Paper software.
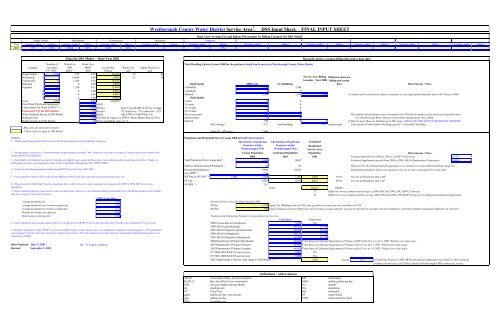
Westborough County <strong>Water</strong> District Service Area 1 , DSS Input Sheet, FINAL INPUT SHEET<br />
Base Year Average Use and Indoor Percentages by Billing Category for DSS Model 2<br />
Single Family<br />
Multifamily<br />
Commercial<br />
Industrial<br />
Irrigation<br />
Year Average, gpd/a Indoor Average, gpd/a Indoor Average, gpd/a Indoor Average, gpd/a Indoor Average, gpd/a Indoor Average, gpd/a Indoor Average, gpd/a Indoor Average, gpd/a Indoor Average, gpd/a Indoor Average, gpd/a Indoor<br />
2001 195 92% 10668 89% 1269 89% 1350 15%<br />
Data for DSS Model - - Base Year 2001<br />
Reconcile agency account billing data and census data<br />
Number of <strong>Water</strong> Use <strong>Water</strong> Use,<br />
Total Dwelling Units in Census 2000 for the portion of South San Francisco in Westborough County <strong>Water</strong> District<br />
Category Accounts 2001 MGD Use Profile <strong>Water</strong> Use Indoor <strong>Water</strong> Use<br />
FY. 2001 3 gpd/a 2 2001 Percent gcd gcd<br />
Single Family 3,336 195 0.65 70.10% 73 67<br />
Multifamily 6 10,668 0.06 6.90% 61 55<br />
Service Area Billing Difference between<br />
Commercial 76 1,269 0.10 10.35%<br />
Accounts - Year 2000 billing and census<br />
Industrial 0 0.00 0.00%<br />
Single family<br />
2000 Units<br />
No. Buildings<br />
3<br />
data<br />
Data Sources / Notes<br />
Irrigation 87 1,350 0.12 12.66% 1-detached 3,340 3,340<br />
0 0 0.00 0.00% 1-attached 0 0<br />
0 0 0.00 0.00% Subtotal 3,340 3,340 3,340 0 Assume each residential account corresponds to one single family detached unit in the Census (2000)<br />
0 0 0.00 0.00% Multi family<br />
Total 3,505 0.93 100.00% 2-units 0 0<br />
Total <strong>Water</strong> Purchased (produced) 4 = 1.02 MGD 3-4 units 0 0<br />
Unaccounted For <strong>Water</strong> (UFW) 5 = 5.4% Percent From 5 year BAWUA Survey average 5 to 9 units 0 0<br />
Estimated UFW for DSS Model = 7% Percent 7% if actual is < 7%, otherwise = E25 10-19 units 0 0<br />
<strong>Water</strong> Produced for use in DSS Model 0.99 MGD Add UFW to Total <strong>Water</strong> Use 20 or more units 550 6<br />
The number of multi-family units is assumed to be 550 and the number of accounts servicing these units<br />
Peaking Factor 3.68 Provided by Agency or <strong>SFPUC</strong> <strong>Water</strong> Master Plan (or NA) mobile homes 0 0<br />
is 6 (Westborough <strong>Water</strong> District Urban <strong>Water</strong> Management Plan, 2000).<br />
Peaking Factor for DSS Model= 3.7 If NA use default value of 1.6. Subtotal 550 6 6 0 Must be more than one building on an MF meter. (ONLY USE THIS NOTE IF BUILDINGS>METERS)<br />
MF Average = 91.7 units/building 91.7 units/account Units inlude all multi-family dwellings plus the "1-attached" dwellings.<br />
- Blue cells are entered by modeler<br />
- Yellow cells are input to DSS Model Total SF + MF units = 3,890<br />
NOTES<br />
1. - Westborough County <strong>Water</strong> District serves the Westborough area within South San Francisco.<br />
Population and Household Size in Census 2000 forSouth San Francisco<br />
The Portion of South San<br />
Francisco within<br />
Westborough CWD<br />
The Portion of South San<br />
Francisco within<br />
Westborough CWD<br />
Estimated<br />
Residential<br />
Service Area<br />
2 - Average gpd/a is based on a 12-month moving average through December 2001. Indoor use is based on average of 2 lowest consecutive months in the<br />
Census Population Estimated Population Population<br />
Data Sources / Notes<br />
winter (meters read bimonthly).<br />
2000 2001 2001 Estimated growth from 2000 to 2001 (CA DOF <strong>Projections</strong>): 0.57%<br />
3 - Total number of residential accounts is from data provided by water agency for this project (see worksheet with account data in this file). Number of<br />
Total Population from Census data 6 = 9,990 10047 Estimated employment growth from 2000 to 2001 (ABAG Employment <strong>Projections</strong>): 0.80%<br />
multi-family accounts was obtained from data in the Urban <strong>Water</strong> Management Plan, 2000 (UWMP).<br />
Subtract Institutionalized Population = 24 25 <strong>Water</strong> use for the institutionalized population is accounted for in nonresidential billing categories<br />
4 - Total water Purchased (produced) taken from BAWUA for Fiscal Year 2001-2002.<br />
Residential Population = 9,966 10,023 Residential population shown corresponds to the city or cities represented by Census data<br />
Avg. HHS 7 = 2.56<br />
5 - Unaccounted for <strong>Water</strong> (UFW) is the percent difference between the total water purchased and the total water use.<br />
MF Pop @ MF HHS 7 = 1.90 1,045 1,051 1,045 10.5% Percent of Population that is MF<br />
SF Pop = 8,921 8,972 8,972 89.5% Percent of Population that is SF<br />
6 - The portion of the South San Francisco population that is within the service area is assumed to be equal to the BAWUA 2000-2001 service area<br />
SF HHS 7 = 2.67<br />
population.<br />
Total 10,017 100.0%<br />
7 - Initial estimate based on census data for renter occupied units. However it was detemined that the household sizes in the Westborough area are smaller<br />
27 Difference in our estimate and average of 2000-2001 and 2001-2002 BAWUA Surveys<br />
than the average for South San Francisco.<br />
51 Difference in our estimate and the average 2000-2001 and 2001-2002 BAWUA Surveys including institutionalized population<br />
2000 Census Data<br />
Average household size 3.05 Estimate Service Area Dwelling Units for 2001<br />
Average household size of owner-occupied unit 3.02 SF Res 3,359 Equals No. Buldings from cell M21 plus growth in accounts for one year from cell T38<br />
Average household size of renter-occupied unit 3.11 MF Res 550 Equals billing accounts in 2001 from cell C16 times average units per account in cell N30 (or average units per building in cell L30 to minimize population difference in cell N47)<br />
Homeowner vacancy rate (percent) 0.70<br />
Rental vacancy rate (percent) 1.30 Population and Employment Estimates Corresponding to Service Area<br />
Population<br />
Employment<br />
8 - Unaccounted for water assumed equal to the 5-yr average from the BAWUA survey data if greater than 7%, otherwise a minimum of 7% was used.<br />
9 - Based on information in the UWMP, it was assumed that 6 of the commercial accounts were multifamily residential (containing approx. 550 apartments)<br />
and consumed 1/3 of the total water use for the commercial accounts. The total commercial accounts and water consumption reported by the agency were<br />
adjusted accordingly.<br />
2000 Census data for jurisdiction 9,990 NA<br />
2000 ABAG (jurisdictional) 60,552 53,190<br />
2005 ABAG Projection (jurisdictional) 62,600 55,330<br />
2000 ABAG (subregional) 60,732 53,230<br />
2005 ABAG Projection (subregional) 62,800 55,370<br />
2000 Department of Finance Benchmark 60,552 From State of California Department of Finance (DOF) table E-4 as of 4-1-2000. Website www.dof.ca.gov<br />
Data Prepared : July 23, 2003 By: N. Foged, J Hudson 2001 Department of Finance Estimate 60,900 From State of California Department of Finance table E-4 as of 1-1-2001. Website www.dof.ca.gov<br />
Revised: September 5, 2003 2002 Department of Finance Estimate 60,800 From State of California Department of Finance table E-4 as of 1-1-2002. Website www.dof.ca.gov<br />
FY 2000-2001 BAWUA service area 9,990 NA<br />
FY 2001-2002 BAWUA service area 9,990 NA<br />
2001 Employment in Service Area (input to DSS Model) = 1,610 Assume 3% of South San Francisco 2000 ABAG subregional employment (escalated to 2001 using the<br />
assumed growth rate in cell T39) is found in Westborough CWD commercial sectors<br />
Definitions / Abbreviations<br />
ABAG Association of Bay Area Governments MF multi family<br />
BAWUA Bay Area <strong>Water</strong> Users Association MGD million gallons per day<br />
DSS Decision Support System Model No. number<br />
du dwelling unit Pop population<br />
FY Fiscal Year Res residential<br />
gpd/a gallons per day / per account SF single family<br />
gpd gallons per day UFW unaccounted for water<br />
HHS<br />
household size


