

SFPUC Wholesale Customer Water Demand Projections ... - BAWSCA
SFPUC Wholesale Customer Water Demand Projections ... - BAWSCA
SFPUC Wholesale Customer Water Demand Projections ... - BAWSCA

Create successful ePaper yourself
Turn your PDF publications into a flip-book with our unique Google optimized e-Paper software.
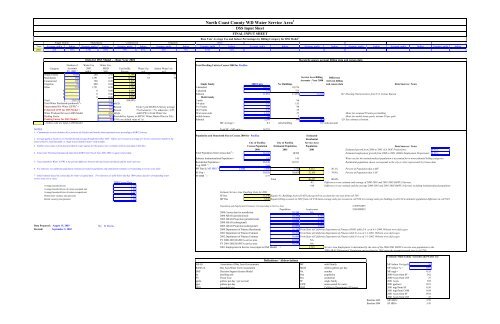
North Coast County WD <strong>Water</strong> Service Area 1<br />
DSS Input Sheet<br />
FINAL INPUT SHEET<br />
Base Year Average Use and Indoor Percentages by Billing Category for DSS Model 2<br />
Single Family<br />
Multifamily<br />
Commercial<br />
Irrigation<br />
Other<br />
Year Average, gpd/a Indoor Average, gpd/a Indoor Average, gpd/a Indoor Average, gpd/a Indoor Average, gpd/a Indoor Average, gpd/a Indoor Average, gpd/a Indoor Average, gpd/a Indoor Average, gpd/a Indoor Average, gpd/a Indoor<br />
2001 260 75% 1391 85% 790 85% 600 0% 1721 32%<br />
Data for DSS Model - - Base Year 2001<br />
Number of <strong>Water</strong> Use <strong>Water</strong> Use,<br />
Total Dwelling Units in Census 2000 for Pacifica<br />
Category Accounts 2001 MGD Use Profile <strong>Water</strong> Use Indoor <strong>Water</strong> Use<br />
FY. 2001 3 gpd/a 2 2001 Percent gcd gcd<br />
Single Family 9,309 260 2.42 71.30% 75 57<br />
Multifamily 392 1,391 0.55 16.07% 65 56<br />
Service Area Billing<br />
Commercial 250 790 0.20 5.81%<br />
Accounts - Year 2000<br />
Irrigation 59 600 0.04 1.04%<br />
Single family<br />
2000 Units<br />
No. Buildings<br />
3<br />
Other 114 1,721 0.20 5.78% 1-detached 10,276 10,276<br />
0 0 0.00 0.00% 1-attached 775 775<br />
0 0 0.00 0.00% Subtotal 11,051 11,051 11,218 167<br />
0 0 0.00 0.00% Multi family<br />
Total 10,123 3.39 100.00% 2-units 172 86<br />
Total <strong>Water</strong> Purchased (produced) 4 = 3.40 MGD 3-4 units 535 153<br />
Unaccounted For <strong>Water</strong> (UFW) 5 = 6% Percent From 5 year BAWUA Survey average 5 to 9 units 686 98<br />
Estimated UFW for DSS Model = 7% Percent 7% if actual is < 7%, otherwise = E25 10-19 units 370 25<br />
<strong>Water</strong> Produced for use in DSS Model 3.63 MGD Add UFW to Total <strong>Water</strong> Use 20 or more units 1,343 27<br />
Peaking Factor NA Provided by Agency or <strong>SFPUC</strong> <strong>Water</strong> Master Plan (or NA) mobile homes 98 2<br />
Peaking Factor for DSS Model= 1.6 If NA use default value of 1.6. Subtotal 3,204 390 362 -29<br />
- Yellow cells are input to DSS Model MF Average = 8.2 units/building 8.9 units/account<br />
NOTES Total SF + MF units = 14,255<br />
1. - Communities served (includes all or portions of) Pacifica and nearby unincorporated areas according to BAWUA survey<br />
Population and Household Size in Census 2000 for Pacifica<br />
2 - Average gpd/a is based on a 12-month moving average through December 2001. Indoor use is based on average of 2 lowest consecutive months in the<br />
winter if meters read bimonthly, or single lowest month if meters read monthly.<br />
3 - Number of accounts is from data provided by water agency for this project (see worksheet with account data in this file)<br />
4 - Total water Purchased (produced) taken from BAWUA for Fiscal Year 2001-2002 or agency if provided.<br />
5 - Unaccounted for <strong>Water</strong> (UFW) is the percent difference between the total water purchased and the total water use.<br />
6 - For reference see additional population estimates provided in population and employment estimates corresponding to service area table.<br />
Estimated<br />
Residential<br />
City of Pacifica City of Pacifica Service Area<br />
Census Population Estimated Population Population<br />
Reconcile agency account billing data and census data<br />
Meter for assumed 50 units per building<br />
Meter for mobile home parks, assume 50 per park<br />
See estimate at bottom.<br />
Data Sources / Notes<br />
Data Sources / Notes<br />
2000 2001 2001 Estimated growth from 2000 to 2001 (CA DOF <strong>Projections</strong>): 0.81%<br />
Total Population from Census data 6 = 38,390 38700 Estimated employment growth from 2000 to 2001 (ABAG Employment <strong>Projections</strong>): 0.93%<br />
Subtract Institutionalized Population = 142 143 <strong>Water</strong> use for the institutionalized population is accounted for in nonresidential billing categories<br />
Residential Population = 38,248 38,557 Residential population shown corresponds to the city or cities represented by Census data<br />
Avg. HHS 7 = 2.68<br />
MF Pop @ MF HHS 7 = 2.40 7,690 7,752 8,352 20.1% Percent of Population that is MF<br />
SF Pop = 30,558 30,805 32,105 79.9% Percent of Population that is SF<br />
7 - Initial estimate based on census data for renter occupied units. For reference see table below that has 2000 census data for corresponding water<br />
SF HHS 7 = 2.77<br />
service area city or cities.<br />
Total 40,457 100.0%<br />
2000 Census Data -43 Difference in our estimate and average of 2000-2001 and 2001-2002 BAWUA Surveys<br />
Average household size 2.73 -186 Difference in our estimate and the average 2000-2001 and 2001-2002 BAWUA Surveys including institutionalized population<br />
Average household size of owner-occupied unit 2.88<br />
Average household size of renter-occupied unit 2.41 Estimate Service Area Dwelling Units for 2001<br />
Homeowner vacancy rate (percent) 0.20 SF Res 11,140 Equals No. Buildings from cell M21 plus growth in accounts for one year from cell T38<br />
Rental vacancy rate (percent) 1.90 MF Res 3,230 Equals billing accounts in 2001 from cell C16 times average units per account in cell N30 (or average units per building in cell L30 to minimize population difference in cell N47)<br />
Population and Employment Estimates Corresponding to Service Area 2.585765855<br />
Population Employment 2.881909923<br />
2000 Census data for jurisdiction 38,390 NA<br />
2000 ABAG (jurisdictional) 38,390 4,740<br />
2005 ABAG Projection (jurisdictional) 39,900 4,960<br />
2000 ABAG (subregional) 38,445 4,740<br />
Data Prepared : August 15, 2003 By: B. Skeens 2005 ABAG Projection (subregional) 40,000 4,960<br />
Revised: September 5, 2003 2000 Department of Finance Benchmark 38,390 From State of California Department of Finance (DOF) table E-4 as of 4-1-2000. Website www.dof.ca.gov<br />
2001 Department of Finance Estimate 38,700 From State of California Department of Finance table E-4 as of 1-1-2001. Website www.dof.ca.gov<br />
2002 Department of Finance Estimate 38,600 From State of California Department of Finance table E-4 as of 1-1-2002. Website www.dof.ca.gov<br />
FY 2000-2001 BAWUA service area 40,500 NA<br />
FY 2001-2002 BAWUA service area 40,500 NA<br />
2001 Employment in Service Area (input to DSS Model) = 5,797 Service Area Employment is determined by the ratio of the 2000-2001 BAWUA service area population to the<br />
2000 ABAG Subregional Population and escalated to 2001 using the assumed growth rate in cell T39.<br />
Difference<br />
between billing<br />
and census data<br />
Housing Characteristics from U.S. Census Bureau<br />
Estimate Multi Family Accounts and <strong>Water</strong> Use<br />
Definitions / Abbreviations<br />
ABAG Association of Bay Area Governments MF multi family MF Indoor Use (gcd)= 56<br />
BAWUA Bay Area <strong>Water</strong> Users Association MGD million gallons per day MF Indoor % = 85%<br />
DSS Decision Support System Model No. number MF mgd = 0.55<br />
du dwelling unit Pop population 2000 Accts from SF 362<br />
FY Fiscal Year Res residential 2000 Accts from COM 27<br />
gpd/a gallons per day / per account SF single family 2001 Accts 392<br />
gpd gallons per day UFW unaccounted for water 2001 gpd/acct 1391<br />
HHS household size DOF California Department of Finance 2001 mgd from SF 0.50<br />
2001 mgd from COM 0.04<br />
2001 Accts from SF 1934<br />
2001 Accts from COM 47<br />
Baseline H45 MF HHS= 2.59<br />
Baseline H44 SF HHS= 3.45


