

SFPUC Wholesale Customer Water Demand Projections ... - BAWSCA
SFPUC Wholesale Customer Water Demand Projections ... - BAWSCA
SFPUC Wholesale Customer Water Demand Projections ... - BAWSCA

Create successful ePaper yourself
Turn your PDF publications into a flip-book with our unique Google optimized e-Paper software.
SECTIONTHREE<br />
Establishing Base - Year Conditions<br />
Fixture models are used for two purposes:<br />
• To model the base-year water use, accounting for and reconciling the fixture data to what the<br />
current level of efficiency is in the homes and businesses, and<br />
• To forecast the impact of replacing the current inefficient fixtures with more efficient models<br />
over time in existing base-year accounts and in new accounts. These replacements result in<br />
water savings that are incorporated into the demand projections and are discussed in Section<br />
4 of this report.<br />
For this study, a typical model has up to 8 fixture models. The number of fixture models applied<br />
is related to the number of applicable customer-billing categories for each wholesale customer.<br />
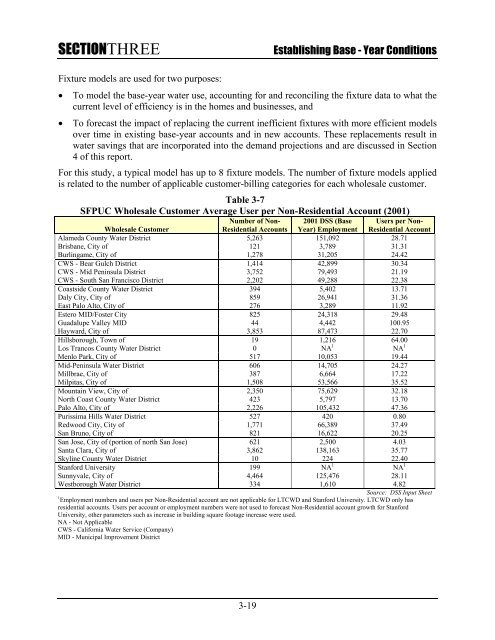
Table 3-7<br />
<strong>SFPUC</strong> <strong>Wholesale</strong> <strong>Customer</strong> Average User per Non-Residential Account (2001)<br />
<strong>Wholesale</strong> <strong>Customer</strong><br />
Number of Non-<br />
Residential Accounts<br />
2001 DSS (Base<br />
Year) Employment<br />
Users per Non-<br />
Residential Account<br />
Alameda County <strong>Water</strong> District 5,263 151,092 28.71<br />
Brisbane, City of 121 3,789 31.31<br />
Burlingame, City of 1,278 31,205 24.42<br />
CWS - Bear Gulch District 1,414 42,899 30.34<br />
CWS - Mid Peninsula District 3,752 79,493 21.19<br />
CWS - South San Francisco District 2,202 49,288 22.38<br />
Coastside County <strong>Water</strong> District 394 5,402 13.71<br />
Daly City, City of 859 26,941 31.36<br />
East Palo Alto, City of 276 3,289 11.92<br />
Estero MID/Foster City 825 24,318 29.48<br />
Guadalupe Valley MID 44 4,442 100.95<br />
Hayward, City of 3,853 87,473 22.70<br />
Hillsborough, Town of 19 1,216 64.00<br />
Los Trancos County <strong>Water</strong> District 0 NA 1 NA 1<br />
Menlo Park, City of 517 10,053 19.44<br />
Mid-Peninsula <strong>Water</strong> District 606 14,705 24.27<br />
Millbrae, City of 387 6,664 17.22<br />
Milpitas, City of 1,508 53,566 35.52<br />
Mountain View, City of 2,350 75,629 32.18<br />
North Coast County <strong>Water</strong> District 423 5,797 13.70<br />
Palo Alto, City of 2,226 105,432 47.36<br />
Purissima Hills <strong>Water</strong> District 527 420 0.80<br />
Redwood City, City of 1,771 66,389 37.49<br />
San Bruno, City of 821 16,622 20.25<br />
San Jose, City of (portion of north San Jose) 621 2,500 4.03<br />
Santa Clara, City of 3,862 138,163 35.77<br />
Skyline County <strong>Water</strong> District 10 224 22.40<br />
Stanford University 199 NA 1 NA 1<br />
Sunnyvale, City of 4,464 125,476 28.11<br />
Westborough <strong>Water</strong> District 334 1,610 4.82<br />
Source: DSS Input Sheet<br />
1 Employment numbers and users per Non-Residential account are not applicable for LTCWD and Stanford University. LTCWD only has<br />
residential accounts. Users per account or employment numbers were not used to forecast Non-Residential account growth for Stanford<br />
University, other parameters such as increase in building square footage increase were used.<br />
NA - Not Applicable<br />
CWS - California <strong>Water</strong> Service (Company)<br />
MID - Municipal Improvement District<br />
3-19


