

SFPUC Wholesale Customer Water Demand Projections ... - BAWSCA
SFPUC Wholesale Customer Water Demand Projections ... - BAWSCA
SFPUC Wholesale Customer Water Demand Projections ... - BAWSCA

You also want an ePaper? Increase the reach of your titles
YUMPU automatically turns print PDFs into web optimized ePapers that Google loves.
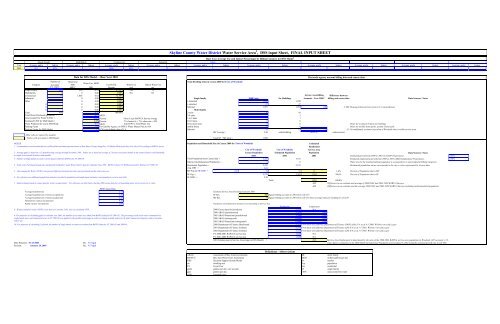
Skyline County <strong>Water</strong> District <strong>Water</strong> Service Area 1 , DSS input Sheet, FINAL INPUT SHEET<br />
Base Year Average Use and Indoor Percentages by Billing Category for DSS Model 2<br />
Single Family<br />
Multifamily<br />
Commercial<br />
Industrial<br />
Other<br />
Year Average, gpd/a Indoor Average, gpd/a Indoor Average, gpd/a Indoor Average, gpd/a Indoor Average, gpd/a Indoor Average, gpd/a Indoor Average, gpd/a Indoor Average, gpd/a Indoor Average, gpd/a Indoor Average, gpd/a Indoor<br />
2001 318 62% 1868 62%<br />
Data for DSS Model - - Base Year 2001<br />
Reconcile agency account billing data and census data<br />
Number of <strong>Water</strong> Use<br />
Total Dwelling Units in Census 2000 for Town of Woodside<br />
Category Accounts 9<br />
<strong>Water</strong> Use, MGD<br />
2001<br />
Use Profile <strong>Water</strong> Use Indoor <strong>Water</strong> Use<br />
FY. 2001 3 gpd/a 2 2001 Percent gcd gcd<br />
Single Family 448 318 0.14 87.50% 116 72<br />
Multifamily 0 0 0.00 0.00% NA NA<br />
Commercial 10 1,868 0.02 12.50%<br />
Service Area Billing Difference between<br />
Industrial 0 0.00 0.00%<br />
Single family<br />
2000 Units<br />
No. Buildings<br />
Accounts - Year 2000 3 billing and census data<br />
Data Sources / Notes<br />
Other 0 0.00 0.00% 1-detached 1,930 1,930<br />
0 0 0.00 0.00% 1-attached 27 27<br />
0 0 0.00 0.00% Subtotal 1,957 1,957 448 -1,509 Housing Characteristics from U.S. Census Bureau<br />
0 0 0.00 0.00% Multi family<br />
Total 458 0.16 100.00% 2-units 20 10<br />
Total <strong>Water</strong> Purchased (produced) 4 = 0.17 MGD 3-4 units 7 2<br />
Unaccounted For <strong>Water</strong> (UFW) 5 = 8.0% Percent From 5 year BAWUA Survey average 5 to 9 units 5 1<br />
Estimated UFW for DSS Model = 8.0% Percent 7% if actual is < 7%, otherwise = E25 10-19 units 0 0<br />
<strong>Water</strong> Produced for use in DSS Mode 0.17 MGD Add UFW to Total <strong>Water</strong> Use 20 or more units 0 0<br />
Meter for assumed 50 units per building<br />
Peaking Factor 2.05 Provided by Agency or <strong>SFPUC</strong> <strong>Water</strong> Master Plan (or NA mobile homes 0 0<br />
Meter for mobile home parks, assume 50 per park<br />
Peaking Factor for DSS Model= 2.1 If NA use default value of 1.6 Subtotal 32 13 0 -13 No multifamily accounts in portion of Woodside that is within service area.<br />
MF Average = 2.46 units/building #DIV/0! units/account<br />
- Blue cells are entered by modeler<br />
- Yellow cells are input to DSS Model Total SF + MF units = 1,989<br />
NOTES<br />
1. - Communities served include the town of Woodside and unincorporated areas of San Mateo County along Hwy 35 (Skyline Blvd) from Hwy 84 to Hwy 92 according to BAWUA survey<br />
Population and Household Size in Census 2000 for Town of Woodside Estimated<br />
Residential<br />
City of Woodside City of Woodside Service Area<br />
Census Population Estimated Population Population<br />
2 - Average gpd/a is based on a 12-month moving average through December 2001. Indoor use is based on average of 2 lowest consecutive months in the winter if meters read bimonthly,<br />
or single lowest month if meters read monthly.<br />
3 - Number of single family accounts is from data provided by BAWUA for FY 2000-01.<br />
4 - Total water Purchased (produced) calculated from Skyline County <strong>Water</strong> District data for Calendar Year 2001. BAWUA shows 0.2 MGD purchased by Skyline in FY 2001-02.<br />
5 - Unaccounted for <strong>Water</strong> (UFW) is the percent difference between the total water purchased and the total water use.<br />
6 - For reference see additional population estimates provided in population and employment estimates corresponding to service area table.<br />
7 - Initial estimate based on census data for renter occupied units. For reference see table below that has 2000 census data for corresponding water service area city or cities.<br />
Data Sources / Notes<br />
2000 2001 2001 Estimated growth from 2000 to 2001 (CA DOF <strong>Projections</strong>): 0.43%<br />
Total Population from Census data 6 = 5,352 5375 Estimated employment growth from 2000 to 2001 (ABAG Employment <strong>Projections</strong>): 0.00%<br />
Subtract Institutionalized Population = 0 0 <strong>Water</strong> use for the institutionalized population is accounted for in nonresidential billing categories<br />
Residential Population = 5,352 5,375 Residential population shown corresponds to the city or cities represented by Census data<br />
Avg. HHS 7 = 2.69<br />
MF Pop @ MF HHS 7 = 2.27 73 73 0 1.4% Percent of Population that is MF<br />
SF Pop = 5,279 5,302 1,210 98.6% Percent of Population that is SF<br />
SF HHS 7 = 2.70<br />
Total 1,210 100.0%<br />
-439 Difference in our estimate and average of 2000-2001 and 2001-2002 BAWUA Surveys<br />
-439 Difference in our estimate and the average 2000-2001 and 2001-2002 BAWUA Surveys including institutionalized population<br />
2000 Census Data<br />
Average household size 2.74 Estimate Service Area Dwelling Units for 2001<br />
Average household size of owner-occupied unit 2.80 SF Res 448 Equals billing accounts in 2001 from cell C15<br />
Average household size of renter-occupied unit 2.27 MF Res 0 Equals billing accounts in 2001 from cell C16 times average units per building in cell L30<br />
Homeowner vacancy rate (percent) 0.50<br />
Rental vacancy rate (percent) 2.60 Population and Employment Estimates Corresponding to Service Area<br />
Population<br />
Employment<br />
8 - If unaccounted for water (UFW) is less than zero, assume 5.0%, else use calculated UFW.<br />
9 -For purposes of calculating gpd/a in calendar year 2001, the number of accounts were taken from BAWUA data for FY 2001-02. The percentage of the total water consumption by<br />
single family users and commercial users in FY 2001-02 was applied to the monthly total usage in order to estimate monthly values for SF and Commercial categories and to calculate<br />
indoor use.<br />
10 -For purposes of calculating % growth, the number of single family accounts were taken from BAWUA data for FY 2001-02 and 2000-01.<br />
2000 Census data for jurisdiction 5,352 NA<br />
2000 ABAG (jurisdictional) 5,352 2,050<br />
2005 ABAG Projection (jurisdictional) 5,500 2,050<br />
2000 ABAG (subregional) 6,456 2,050<br />
2005 ABAG Projection (subregional) 6,600 2,050<br />
2000 Department of Finance Benchmark 5,352 From State of California Department of Finance (DOF) table E-4 as of 4-1-2000. Website www.dof.ca.gov<br />
2001 Department of Finance Estimate 5,375 From State of California Department of Finance table E-4 as of 1-1-2001. Website www.dof.ca.gov<br />
2002 Department of Finance Estimate 5,375 From State of California Department of Finance table E-4 as of 1-1-2002. Website www.dof.ca.gov<br />
FY 2000-2001 BAWUA service area 1,649 NA<br />
FY 2001-2002 BAWUA service area 1,649 NA<br />
2001 Employment in Service Area (input to DSS Model) = 224 Service Area Employment is determined by the ratio of the 2000-2001 BAWUA service area population in Woodside (167 accounts x 3.5,<br />
Data Prepared : 07-23-2003 By: N. Foged from Agency comments) to the 2000 ABAG Jurisdictional Population and escalated to 2001 using the assumed growth rate in cell T39.<br />
Revised: January 28, 2004<br />
By: N. Foged<br />
Definitions / Abbreviations<br />
ABAG Association of Bay Area Governments MF multi family<br />
BAWUA Bay Area <strong>Water</strong> Users Association MGD million gallons per day<br />
DSS Decision Support System Model No. number<br />
du dwelling unit Pop population<br />
FY Fiscal Year Res residential<br />
gpd/a gallons per day / per account SF single family<br />
gpd gallons per day UFW unaccounted for water<br />
HHS<br />
household size


