

SFPUC Wholesale Customer Water Demand Projections ... - BAWSCA
SFPUC Wholesale Customer Water Demand Projections ... - BAWSCA
SFPUC Wholesale Customer Water Demand Projections ... - BAWSCA

You also want an ePaper? Increase the reach of your titles
YUMPU automatically turns print PDFs into web optimized ePapers that Google loves.
SECTIONFIVE<br />
<strong>Water</strong> <strong>Demand</strong> <strong>Projections</strong><br />
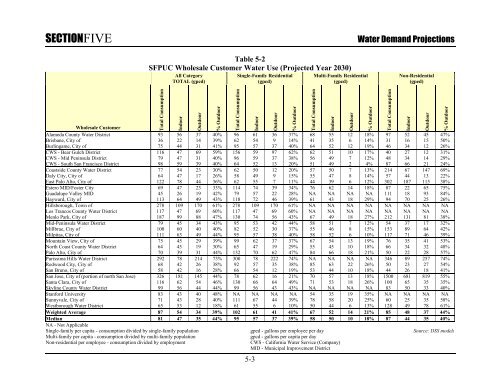
Table 5-2<br />
<strong>SFPUC</strong> <strong>Wholesale</strong> <strong>Customer</strong> <strong>Water</strong> Use (Projected Year 2030)<br />
All Category<br />
TOTAL (gpcd)<br />
Single-Family Residential<br />
(gpcd)<br />
Multi-Family Residential<br />
(gpcd)<br />
Non-Residential<br />
(gped)<br />
Total Consumption<br />
Indoor<br />
Outdoor<br />
% Outdoor<br />
Total Consumption<br />
<strong>Wholesale</strong> <strong>Customer</strong><br />
Alameda County <strong>Water</strong> District 93 56 37 40% 96 61 36 37% 68 55 12 18% 97 52 45 47%<br />
Brisbane, City of 36 22 14 39% 62 54 9 14% 41 35 6 14% 31 16 15 50%<br />
Burlingame, City of 75 44 31 41% 95 57 37 40% 64 52 12 19% 46 34 12 26%<br />
CWS - Bear Gulch District 116 47 69 59% 156 59 97 62% 62 51 10 17% 40 27 12 31%<br />
CWS - Mid Peninsula District 79 47 31 40% 96 59 37 38% 56 49 7 12% 48 34 14 29%<br />
CWS - South San Francisco District 98 59 39 40% 64 52 13 20% 51 49 2 4% 87 66 21 24%<br />
Coastside County <strong>Water</strong> District 77 54 23 30% 62 50 12 20% 57 50 7 13% 214 67 147 69%<br />
Daly City, City of 64 47 17 26% 58 49 9 15% 55 47 8 14% 57 44 13 22%<br />
East Palo Alto, City of 122 78 44 36% 62 55 7 11% 44 39 6 12% 302 187 115 38%<br />
Estero MID/Foster City 69 47 23 33% 114 74 39 34% 76 62 14 18% 87 22 65 75%<br />
Guadalupe Valley MID 45 26 19 42% 79 57 22 28% NA NA NA NA 111 18 93 84%<br />
Hayward, City of 113 64 49 43% 118 72 46 39% 61 43 18 29% 94 70 25 26%<br />
Hillsborough, Town of 278 109 170 61% 278 109 170 61% NA NA NA NA NA NA NA NA<br />
Los Trancos County <strong>Water</strong> District 117 47 69 60% 117 47 69 60% NA NA NA NA NA NA NA NA<br />
Menlo Park, City of 187 99 88 47% 130 74 56 43% 67 49 18 27% 212 131 81 38%<br />
Mid-Peninsula <strong>Water</strong> District 79 45 34 43% 95 53 42 44% 58 51 7 12% 54 37 17 32%<br />
Millbrae, City of 100 60 40 40% 82 52 30 37% 55 46 8 15% 153 89 64 42%<br />
Milpitas, City of 111 63 49 44% 95 57 38 40% 58 52 6 10% 117 71 46 39%<br />
Mountain View, City of 75 45 29 39% 99 62 37 37% 67 54 13 19% 76 35 41 53%<br />
North Coast County <strong>Water</strong> District 64 45 19 30% 65 47 19 29% 55 45 10 18% 66 34 32 48%<br />
Palo Alto, City of 70 39 31 44% 132 70 62 47% 84 66 18 21% 50 22 28 57%<br />
Purissima Hills <strong>Water</strong> District 292 78 214 73% 300 78 222 74% NA NA NA NA 346 89 257 74%<br />
Redwood City, City of 68 42 26 38% 92 57 35 38% 85 63 22 26% 50 23 27 54%<br />
San Bruno, City of 58 42 16 28% 66 54 12 19% 53 44 10 18% 44 26 18 41%<br />
San Jose, City of (portion of north San Jose) 326 181 145 44% 78 62 16 21% 70 57 13 18% 1500 681 819 55%<br />
Santa Clara, City of 116 62 54 46% 130 66 64 49% 71 53 18 26% 100 65 35 35%<br />
Skyline County <strong>Water</strong> District 99 56 44 44% 99 56 43 43% NA NA NA NA 83 50 33 40%<br />
Stanford University 83 43 40 48% NA NA NA NA 54 35 19 35% NA NA NA NA<br />
Sunnyvale, City of 71 43 28 40% 111 67 44 39% 78 58 20 25% 60 25 35 58%<br />
Westborough <strong>Water</strong> District 65 53 12 18% 61 55 6 10% 50 44 6 13% 128 49 78 61%<br />
Weighted Average 87 54 34 39% 102 61 41 41% 67 52 14 21% 85 48 37 44%<br />
Median 81 47 35 44% 95 57 37 39% 58 50 10 18% 87 44 35 40%<br />
NA - Not Applicable<br />
Single-family per capita - consumption divided by single-family population<br />
gped - gallons per employee per day<br />
Source: DSS models<br />
Multi-family per capita - consumption divided by multi-family population<br />
gpcd - gallons per capita per day<br />
Non-residential per employee - consumption divided by employment<br />
CWS - California <strong>Water</strong> Service (Company)<br />
MID - Municipal Improvement District<br />
5-3<br />
Indoor<br />
Outdoor<br />
% Outdoor<br />
Total Consumption<br />
Indoor<br />
Outdoor<br />
% Outdoor<br />
Total Consumption<br />
Indoor<br />
Outdoor<br />
% Outdoor


