

SFPUC Wholesale Customer Water Demand Projections ... - BAWSCA
SFPUC Wholesale Customer Water Demand Projections ... - BAWSCA
SFPUC Wholesale Customer Water Demand Projections ... - BAWSCA

Create successful ePaper yourself
Turn your PDF publications into a flip-book with our unique Google optimized e-Paper software.
SECTIONFIVE<br />
<strong>Water</strong> <strong>Demand</strong> <strong>Projections</strong><br />
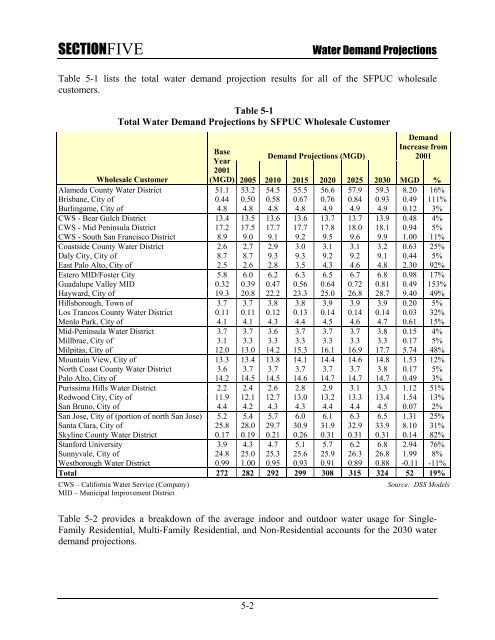
Table 5-1 lists the total water demand projection results for all of the <strong>SFPUC</strong> wholesale<br />
customers.<br />
Table 5-1<br />
Total <strong>Water</strong> <strong>Demand</strong> <strong>Projections</strong> by <strong>SFPUC</strong> <strong>Wholesale</strong> <strong>Customer</strong><br />
<strong>Demand</strong><br />
Increase from<br />
2001<br />
Base<br />
Year<br />
<strong>Demand</strong> <strong>Projections</strong> (MGD)<br />
2001<br />
(MGD) 2005 2010 2015 2020 2025 2030 MGD %<br />
<strong>Wholesale</strong> <strong>Customer</strong><br />
Alameda County <strong>Water</strong> District 51.1 53.2 54.5 55.5 56.6 57.9 59.3 8.20 16%<br />
Brisbane, City of 0.44 0.50 0.58 0.67 0.76 0.84 0.93 0.49 111%<br />
Burlingame, City of 4.8 4.8 4.8 4.8 4.9 4.9 4.9 0.12 3%<br />
CWS - Bear Gulch District 13.4 13.5 13.6 13.6 13.7 13.7 13.9 0.48 4%<br />
CWS - Mid Peninsula District 17.2 17.5 17.7 17.7 17.8 18.0 18.1 0.94 5%<br />
CWS - South San Francisco District 8.9 9.0 9.1 9.2 9.5 9.6 9.9 1.00 11%<br />
Coastside County <strong>Water</strong> District 2.6 2.7 2.9 3.0 3.1 3.1 3.2 0.63 25%<br />
Daly City, City of 8.7 8.7 9.3 9.3 9.2 9.2 9.1 0.44 5%<br />
East Palo Alto, City of 2.5 2.6 2.8 3.5 4.3 4.6 4.8 2.30 92%<br />
Estero MID/Foster City 5.8 6.0 6.2 6.3 6.5 6.7 6.8 0.98 17%<br />
Guadalupe Valley MID 0.32 0.39 0.47 0.56 0.64 0.72 0.81 0.49 153%<br />
Hayward, City of 19.3 20.8 22.2 23.3 25.0 26.8 28.7 9.40 49%<br />
Hillsborough, Town of 3.7 3.7 3.8 3.8 3.9 3.9 3.9 0.20 5%<br />
Los Trancos County <strong>Water</strong> District 0.11 0.11 0.12 0.13 0.14 0.14 0.14 0.03 32%<br />
Menlo Park, City of 4.1 4.1 4.3 4.4 4.5 4.6 4.7 0.61 15%<br />
Mid-Peninsula <strong>Water</strong> District 3.7 3.7 3.6 3.7 3.7 3.7 3.8 0.15 4%<br />
Millbrae, City of 3.1 3.3 3.3 3.3 3.3 3.3 3.3 0.17 5%<br />
Milpitas, City of 12.0 13.0 14.2 15.3 16.1 16.9 17.7 5.74 48%<br />
Mountain View, City of 13.3 13.4 13.8 14.1 14.4 14.6 14.8 1.53 12%<br />
North Coast County <strong>Water</strong> District 3.6 3.7 3.7 3.7 3.7 3.7 3.8 0.17 5%<br />
Palo Alto, City of 14.2 14.5 14.5 14.6 14.7 14.7 14.7 0.49 3%<br />
Purissima Hills <strong>Water</strong> District 2.2 2.4 2.6 2.8 2.9 3.1 3.3 1.12 51%<br />
Redwood City, City of 11.9 12.1 12.7 13.0 13.2 13.3 13.4 1.54 13%<br />
San Bruno, City of 4.4 4.2 4.3 4.3 4.4 4.4 4.5 0.07 2%<br />
San Jose, City of (portion of north San Jose) 5.2 5.4 5.7 6.0 6.1 6.3 6.5 1.31 25%<br />
Santa Clara, City of 25.8 28.0 29.7 30.9 31.9 32.9 33.9 8.10 31%<br />
Skyline County <strong>Water</strong> District 0.17 0.19 0.21 0.26 0.31 0.31 0.31 0.14 82%<br />
Stanford University 3.9 4.3 4.7 5.1 5.7 6.2 6.8 2.94 76%<br />
Sunnyvale, City of 24.8 25.0 25.3 25.6 25.9 26.3 26.8 1.99 8%<br />
Westborough <strong>Water</strong> District 0.99 1.00 0.95 0.93 0.91 0.89 0.88 -0.11 -11%<br />
Total 272 282 292 299 308 315 324 52 19%<br />
CWS – California <strong>Water</strong> Service (Company)<br />
MID – Municipal Improvement District<br />
Source: DSS Models<br />
Table 5-2 provides a breakdown of the average indoor and outdoor water usage for Single-<br />
Family Residential, Multi-Family Residential, and Non-Residential accounts for the 2030 water<br />
demand projections.<br />
5-2


