

SFPUC Wholesale Customer Water Demand Projections ... - BAWSCA
SFPUC Wholesale Customer Water Demand Projections ... - BAWSCA
SFPUC Wholesale Customer Water Demand Projections ... - BAWSCA

You also want an ePaper? Increase the reach of your titles
YUMPU automatically turns print PDFs into web optimized ePapers that Google loves.
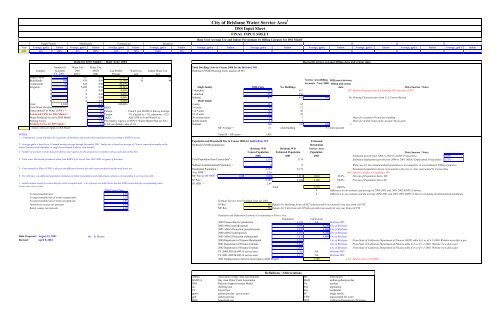
City of Brisbane <strong>Water</strong> Service Area 1<br />
DSS Input Sheet<br />
FINAL INPUT SHEET<br />
Base Year Average Use and Indoor Percentages by Billing Category for DSS Model 2<br />
Single Family<br />
Multifamily<br />
Commercial<br />
Irrigation<br />
Year Average, gpd/a Indoor Average, gpd/a Indoor Average, gpd/a Indoor Average, gpd/a Indoor Average, gpd/a Indoor Average, gpd/a Indoor Average, gpd/a Indoor Average, gpd/a Indoor Average, gpd/a Indoor Average, gpd/a Indoor<br />
2001 165 88% 476 88% 845 76% 5400 0%<br />
Data for DSS Model - - Base Year 2001<br />
Number of <strong>Water</strong> Use <strong>Water</strong> Use,<br />
Total Dwelling Units in Census 2000 for the Brisbane WD<br />
Category Accounts 2001 MGD Use Profile <strong>Water</strong> Use Indoor <strong>Water</strong> Use (Subtract GVMID Housing Units, asuume all SF)<br />
FY. 2001 3 gpd/a 2 2001 Percent gcd gcd<br />
Single Family 941 165 0.16 37.93% 72 63<br />
Multifamily 106 476 0.05 12.36% 50 44<br />
Service Area Billing Difference between<br />
Commercial 99 845 0.08 20.47%<br />
Accounts - Year 2000 billing and census<br />
Irrigation 22 5,400 0.12 29.24%<br />
Single family<br />
2000 Units<br />
No. Buildings<br />
3<br />
data<br />
Data Sources / Notes<br />
0 0 0.00 0.00% 1-detached 617 617 383 Subtract housing units in Guadalupe WD (assume all SF)<br />
0 0 0.00 0.00% 1-attached 258 258<br />
0 0 0.00 0.00% Subtotal 875 875 941 66 Housing Characteristics from U.S. Census Bureau<br />
0 0 0.00 0.00% Multi family<br />
Total 1,169 0.41 100.00% 2-units 133 67<br />
Total <strong>Water</strong> Purchased (produced) 4 = 0.41 MGD 3-4 units 41 12<br />
Unaccounted For <strong>Water</strong> (UFW) 5 = 3% Percent From 5 year BAWUA Survey average 5 to 9 units 141 20<br />
Estimated UFW for DSS Model = 7% Percent 7% if actual is < 7%, otherwise = E25 10-19 units 152 10<br />
<strong>Water</strong> Produced for use in DSS Model 0.44 MGD Add UFW to Total <strong>Water</strong> Use 20 or more units 50 1<br />
Meter for assumed 50 units per building<br />
Peaking Factor 1.90 Provided by Agency or <strong>SFPUC</strong> <strong>Water</strong> Master Plan (or NA) mobile homes 43 1<br />
Meter for mobile home parks, assume 50 per park<br />
Peaking Factor for DSS Model= 1.9 If NA use default value of 1.6. Subtotal 560 110 109 -1<br />
- Yellow cells are input to DSS Model MF Average = 5.1 units/building 5.1 units/account<br />
NOTES Total SF + MF units = 1,435<br />
1. - Communities served (includes all or portions of) Brisbane and nearby unincorporated areas according to BAWUA survey<br />
Population and Household Size in Census 2000 for theBrisbane WD<br />
2 - Average gpd/a is based on a 12-month moving average through December 2001. Indoor use is based on average of 2 lowest consecutive months in the<br />
(Subtract GVMID population)<br />
winter if meters read bimonthly, or single lowest month if meters read monthly.<br />
3 - Number of accounts is from data provided by water agency for this project (see worksheet with account data in this file)<br />
4 - Total water Purchased (produced) taken from BAWUA for Fiscal Year 2001-2002 or agency if provided.<br />
5 - Unaccounted for <strong>Water</strong> (UFW) is the percent difference between the total water purchased and the total water use.<br />
6 - For reference see additional population estimates provided in population and employment estimates corresponding to service area table.<br />
Estimated<br />
Residential<br />
Brisbane WD Brisbane WD Service Area<br />
Census Population Estimated Population Population<br />
Reconcile agency account billing data and census data<br />
Data Sources / Notes<br />
2000 2001 2001 Estimated growth from 2000 to 2001 (CA DOF <strong>Projections</strong>): 0.64%<br />
Total Population from Census data 6 = 3,154 3174 Estimated employment growth from 2000 to 2001 (ABAG Employment <strong>Projections</strong>): 1.73%<br />
Subtract Institutionalized Population = 0 0 <strong>Water</strong> use for the institutionalized population is accounted for in nonresidential billing categories<br />
Residential Population = 3,154 3,174 Residential population shown corresponds to the city or cities represented by Census data<br />
Avg. HHS 7 = 2.20 443 Subtract people in Guadalupe WD<br />
MF Pop @ MF HHS 7 = 1.80 1,008 1,014 1,014 32.0% Percent of Population that is MF<br />
SF Pop = 2,146 2,160 2,160 68.0% Percent of Population that is SF<br />
7 - Initial estimate based on census data for renter occupied units. For reference see table below that has 2000 census data for corresponding water<br />
SF HHS 7 = 2.45<br />
service area city or cities.<br />
Total 3,174 100.0%<br />
2000 Census Data 5 Difference in our estimate and average of 2000-2001 and 2001-2002 BAWUA Surveys<br />
Average household size 2.20 5 Difference in our estimate and the average 2000-2001 and 2001-2002 BAWUA Surveys including institutionalized population<br />
Average household size of owner-occupied unit 2.39<br />
Average household size of renter-occupied unit 1.81 Estimate Service Area Dwelling Units for 2001<br />
Homeowner vacancy rate (percent) 6.90 SF Res 881 Equals No. Buildings from cell M21 plus growth in accounts for one year from cell T38<br />
Rental vacancy rate (percent) 4.10 MF Res 564 Equals No. Units from cell L29 plus growth in accounts for one year from cell T38<br />
Population and Employment Estimates Corresponding to Service Area<br />
Population<br />
Employment<br />
2000 Census data for jurisdiction 3,154 NA Brisbane WD<br />
2000 ABAG (jurisdictional) 3,597 8,100 City of Brisbane<br />
2005 ABAG Projection (jurisdictional) 3,870 8,800 City of Brisbane<br />
2000 ABAG (subregional) 3,597 8,100 City of Brisbane<br />
Data Prepared : August 15, 2003 By: B. Skeens 2005 ABAG Projection (subregional) 3,870 8,800 City of Brisbane<br />
Revised: April 8, 2004 2000 Department of Finance Benchmark 3,597 City of Brisbane From State of California Department of Finance (DOF) table E-4 as of 4-1-2000. Website www.dof.ca.gov<br />
2001 Department of Finance Estimate 3,620 City of Brisbane From State of California Department of Finance table E-4 as of 1-1-2001. Website www.dof.ca.gov<br />
2002 Department of Finance Estimate 3,640 City of Brisbane From State of California Department of Finance table E-4 as of 1-1-2002. Website www.dof.ca.gov<br />
FY 2000-2001 BAWUA service area 3,165 NA Brisbane WD<br />
FY 2001-2002 BAWUA service area 3,174 NA Brisbane WD<br />
2001 Employment in Service Area (input to DSS Model) = 3,789 4311 Subtract jobs in GVMID<br />
Definitions / Abbreviations<br />
ABAG Association of Bay Area Governments MF multi family<br />
BAWUA Bay Area <strong>Water</strong> Users Association MGD million gallons per day<br />
DSS Decision Support System Model No. number<br />
du dwelling unit Pop population<br />
FY Fiscal Year Res residential<br />
gpd/a gallons per day / per account SF single family<br />
gpd gallons per day UFW unaccounted for water<br />
HHS household size DOF California Department of Finance


