

SFPUC Wholesale Customer Water Demand Projections ... - BAWSCA
SFPUC Wholesale Customer Water Demand Projections ... - BAWSCA
SFPUC Wholesale Customer Water Demand Projections ... - BAWSCA

You also want an ePaper? Increase the reach of your titles
YUMPU automatically turns print PDFs into web optimized ePapers that Google loves.
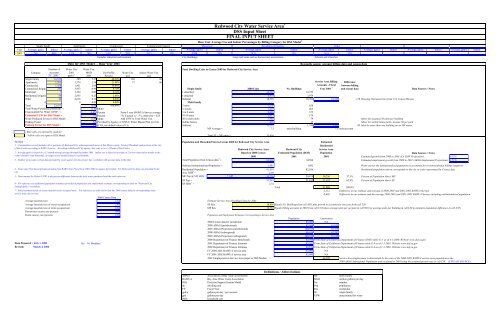
Base Year Average Use and Indoor Percentages by Billing Category for DSS Model 2<br />
Single family<br />
Apartments<br />
Commercial<br />
Commercial Irrigation<br />
Municipal<br />
Residential Irrigation<br />
Other<br />
Year Average, gpd/a Indoor Average, gpd/a Indoor Average, gpd/a Indoor Average, gpd/a Indoor Average, gpd/a Indoor Average, gpd/a Indoor Average, gpd/a Indoor Average, gpd/a Indoor Average, gpd/a Indoor Average, gpd/a Indoor<br />
2001 289 66% 1,374 78% 1451 79% 3933 0% 2334 29% 2835 0% 2618 35%<br />
Includes industrial and hospitals City Buildings Large turf areas such as homeowner associations Schools and Churches<br />
Data for DSS Model - - Base Year 2001<br />
Number of <strong>Water</strong> Use <strong>Water</strong> Use,<br />
Total Dwelling Units in Census 2000 for Redwood City Service Area<br />
Category Accounts 2001 MGD Use Profile <strong>Water</strong> Use Indoor <strong>Water</strong> Use<br />
FY. 2001 3 gpd/a 2 2001 Percent gcd gcd<br />
Single family 18,525 289 5.35 48.24% 104 68<br />
Apartments 1,701 1,374 2.34 21.08% 77 60<br />
Service Area Billing Difference<br />
Commercial 1,439 1,451 2.09 18.84%<br />
Accounts - Fiscal between billing<br />
Commercial Irrigatio 245 3,933 0.96 8.70%<br />
Single family<br />
2000 Units<br />
No. Buildings<br />
Year 2001 3 and census data<br />
Municipal 7 2,334 0.02 0.14% 1-detached 14,729 14,729<br />
Residential Irrigation 80 2,835 0.23 2.05% 1-attached 3,974 3,974<br />
Other 40 2,618 0.10 0.94% Subtotal 18,703 18,703 18,525 -178<br />
0 0 0.00 0.00% Multi family<br />
Total 22,037 11.08 100.00% 2-units 1,276 638<br />
Total <strong>Water</strong> Purchased (produced) 4 = 11.81 MGD 3-4 units 1,629 465<br />
Unaccounted For <strong>Water</strong> (UFW) 5 = 4.6% Percent From 5 year BAWUA Survey average 5 to 9 units 2,628 375<br />
Estimated UFW for DSS Model = 7% Percent 7% if actual is < 7%, otherwise = E25 10-19 units 2,613 174<br />
<strong>Water</strong> Produced for use in DSS Model 11.86 MGD Add UFW to Total <strong>Water</strong> Use 20 or more units 3,940 79<br />
Peaking Factor NA Provided by Agency or <strong>SFPUC</strong> <strong>Water</strong> Master Plan (or NA) mobile homes 628 13<br />
Peaking Factor for DSS Model= 1.6 If NA use default value of 1.6. Subtotal 12,712 1,744 1,701 -43<br />
MF Average = 7.3 units/building 7.5 units/account<br />
- Blue cells are entered by modeler<br />
- Yellow cells are input to DSS Model Total SF + MF units = 31,416<br />
NOTES Population and Household Size in Census 2000 for Redwood City Service Area Estimated<br />
1. - Communities served (includes all or portions of) Redwood City, unincorporated areas of San Mateo county, Town of Woodside, and portions of the city<br />
of San Carlos according to BAWUA survey. According to Redwood City agency, they only serve 1-3 blocks of San Carlos.<br />
2 - Average gpd/a is based on a 12-month moving average through December 2001. Indoor use is based on average of 2 lowest consecutive months in the<br />
winter if meters read bimonthly, or single lowest month if meters read monthly.<br />
3 - Number of accounts is from data provided by water agency for this project (see worksheet with account data in this file)<br />
4 - Total water Purchased (produced) taken from BAWUA for Fiscal Year 2001-2002 or agency if provided. For Redwood City data was provided by the<br />
city.<br />
5 - Unaccounted for <strong>Water</strong> (UFW) is the percent difference between the total water purchased and the total water use.<br />
6 - For reference see additional population estimates provided in population and employment estimates corresponding to table on "Redwood City<br />
Demographics" worksheet.<br />
7 - Initial estimate based on census data for renter occupied units. For reference see table below that has 2000 census data for corresponding water<br />
service area city or cities.<br />
Redwood City <strong>Water</strong> Service Area 1<br />
DSS Input Sheet<br />
FINAL INPUT SHEET<br />
Reconcile agency account billing data and census data<br />
Housing Characteristics from U.S. Census Bureau<br />
Meter for assumed 50 units per building<br />
Meter for mobile home parks, assume 50 per park<br />
Must be more than one building on an MF meter.<br />
Residential<br />
Redwood City Service Area Redwood City Service Area<br />
Based on 2000 Census Estimated Population (DOF) Population<br />
Data Sources / Notes<br />
2000 2001 2001 Estimated growth from 2000 to 2001 (CA DOF <strong>Projections</strong>): 0.72%<br />
Total Population from Census data 6 = 83,000 83598 Estimated employment growth from 2000 to 2001 (ABAG Employment <strong>Projections</strong>): 0.77%<br />
Subtract Institutionalized Population = 1,481 1492 <strong>Water</strong> use for the institutionalized population is accounted for in nonresidential billing categories<br />
Residential Population = 81,519 82,106 Residential population shown corresponds to the city or cities represented by Census data<br />
Avg. HHS 7 = 2.59<br />
MF Pop @ MF HHS 7 = 2.38 30,256 30,474 30,256 37.1% Percent of Population that is MF<br />
SF Pop = 51,263 51,633 51,633 62.9% Percent of Population that is SF<br />
SF HHS 7 = 2.74<br />
Total 81,888 100.0%<br />
-1,112 Difference in our estimate and average of 2000-2001 and 2001-2002 BAWUA Surveys<br />
-2,603 Difference in our estimate and the average 2000-2001 and 2001-2002 BAWUA Surveys including institutionalized population<br />
2000 Census Data<br />
Average household size 2.62 Estimate Service Area Dwelling Units for 2001<br />
Average household size of owner-occupied unit 2.61 SF Res 18,838 Equals No. Buildings from cell M21 plus growth in accounts for one year from cell T38<br />
Average household size of renter-occupied unit 2.63 MF Res 12,712 Equals billing accounts in 2001 from cell C16 times average units per account in cell N30 (or average units per building in cell L30 to minimize population difference in cell N47)<br />
Homeowner vacancy rate (percent) 0.40<br />
Rental vacancy rate (percent) 2.30 Population and Employment Estimates Corresponding to Service Area<br />
Population<br />
Employment<br />
2000 Census data for jurisdiction 83,000 NA<br />
2000 ABAG (jurisdictional) 82,944 65,838<br />
2005 ABAG Projection (jurisdictional) 100,593 68,369<br />
2000 ABAG (subregional) 86,434 62,297<br />
2005 ABAG Projection (subregional) 104,558 65,319<br />
2000 Department of Finance Benchmark 82,944 From State of California Department of Finance (DOF) table E-4 as of 4-1-2000. Website www.dof.ca.gov<br />
Data Prepared : July 1, 2003 By: M. Maddaus 2001 Department of Finance Estimate 83,542 From State of California Department of Finance table E-4 as of 1-1-2001. Website www.dof.ca.gov<br />
Revised: March 4, 2004 2002 Department of Finance Estimate 83,876 From State of California Department of Finance table E-4 as of 1-1-2002. Website www.dof.ca.gov<br />
FY 2000-2001 BAWUA service area 83,000 NA<br />
FY 2001-2002 BAWUA service area 83,000 NA<br />
2001 Employment in Service Area (input to DSS Model) = 66,389 Service Area Employment is determined by the ratio of the 2000-2001 BAWUA service area population to the<br />
2000 ABAG Subregional Population and escalated to 2001 using the assumed growth rate in cell T39. (EXPLAIN SOURCE)<br />
Data Sources / Notes<br />
Definitions / Abbreviations<br />
ABAG Association of Bay Area Governments MF multi family<br />
BAWUA Bay Area <strong>Water</strong> Users Association MGD million gallons per day<br />
DSS Decision Support System Model No. number<br />
du dwelling unit Pop population<br />
FY Fiscal Year Res residential<br />
gpd/a gallons per day / per account SF single family<br />
gpd gallons per day UFW unaccounted for water<br />
HHS<br />
household size


