

SFPUC Wholesale Customer Water Demand Projections ... - BAWSCA
SFPUC Wholesale Customer Water Demand Projections ... - BAWSCA
SFPUC Wholesale Customer Water Demand Projections ... - BAWSCA

You also want an ePaper? Increase the reach of your titles
YUMPU automatically turns print PDFs into web optimized ePapers that Google loves.
SECTIONTHREE<br />
Establishing Base - Year Conditions<br />
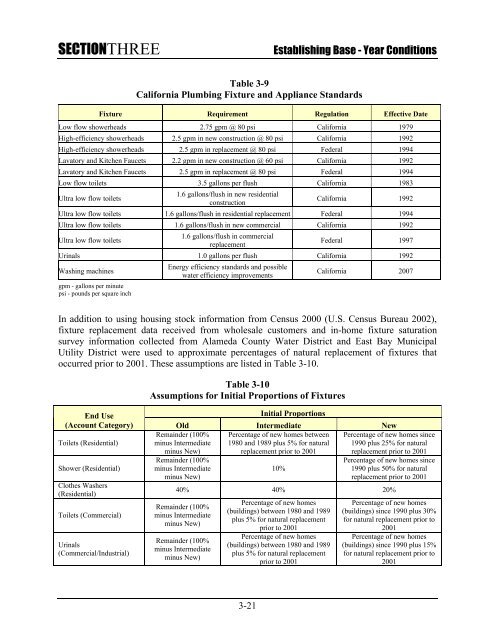
Table 3-9<br />
California Plumbing Fixture and Appliance Standards<br />
Fixture Requirement Regulation Effective Date<br />
Low flow showerheads 2.75 gpm @ 80 psi California 1979<br />
High-efficiency showerheads 2.5 gpm in new construction @ 80 psi California 1992<br />
High-efficiency showerheads 2.5 gpm in replacement @ 80 psi Federal 1994<br />
Lavatory and Kitchen Faucets 2.2 gpm in new construction @ 60 psi California 1992<br />
Lavatory and Kitchen Faucets 2.5 gpm in replacement @ 80 psi Federal 1994<br />
Low flow toilets 3.5 gallons per flush California 1983<br />
Ultra low flow toilets<br />
1.6 gallons/flush in new residential<br />
construction<br />
California 1992<br />
Ultra low flow toilets 1.6 gallons/flush in residential replacement Federal 1994<br />
Ultra low flow toilets 1.6 gallons/flush in new commercial California 1992<br />
Ultra low flow toilets<br />
1.6 gallons/flush in commercial<br />
replacement<br />
Federal 1997<br />
Urinals 1.0 gallons per flush California 1992<br />
Washing machines<br />
gpm - gallons per minute<br />
psi - pounds per square inch<br />
Energy efficiency standards and possible<br />
water efficiency improvements<br />
California 2007<br />
In addition to using housing stock information from Census 2000 (U.S. Census Bureau 2002),<br />
fixture replacement data received from wholesale customers and in-home fixture saturation<br />
survey information collected from Alameda County <strong>Water</strong> District and East Bay Municipal<br />
Utility District were used to approximate percentages of natural replacement of fixtures that<br />
occurred prior to 2001. These assumptions are listed in Table 3-10.<br />
Table 3-10<br />
Assumptions for Initial Proportions of Fixtures<br />
End Use<br />
Initial Proportions<br />
(Account Category) Old Intermediate New<br />
Toilets (Residential)<br />
Remainder (100%<br />
minus Intermediate<br />
minus New)<br />
Percentage of new homes between<br />
1980 and 1989 plus 5% for natural<br />
replacement prior to 2001<br />
Shower (Residential)<br />
Clothes Washers<br />
(Residential)<br />
Toilets (Commercial)<br />
Urinals<br />
(Commercial/Industrial)<br />
Remainder (100%<br />
minus Intermediate<br />
minus New)<br />
10%<br />
Percentage of new homes since<br />
1990 plus 25% for natural<br />
replacement prior to 2001<br />
Percentage of new homes since<br />
1990 plus 50% for natural<br />
replacement prior to 2001<br />
40% 40% 20%<br />
Remainder (100%<br />
minus Intermediate<br />
minus New)<br />
Remainder (100%<br />
minus Intermediate<br />
minus New)<br />
Percentage of new homes<br />
(buildings) between 1980 and 1989<br />
plus 5% for natural replacement<br />
prior to 2001<br />
Percentage of new homes<br />
(buildings) between 1980 and 1989<br />
plus 5% for natural replacement<br />
prior to 2001<br />
Percentage of new homes<br />
(buildings) since 1990 plus 30%<br />
for natural replacement prior to<br />
2001<br />
Percentage of new homes<br />
(buildings) since 1990 plus 15%<br />
for natural replacement prior to<br />
2001<br />
3-21


