

SFPUC Wholesale Customer Water Demand Projections ... - BAWSCA
SFPUC Wholesale Customer Water Demand Projections ... - BAWSCA
SFPUC Wholesale Customer Water Demand Projections ... - BAWSCA

Create successful ePaper yourself
Turn your PDF publications into a flip-book with our unique Google optimized e-Paper software.
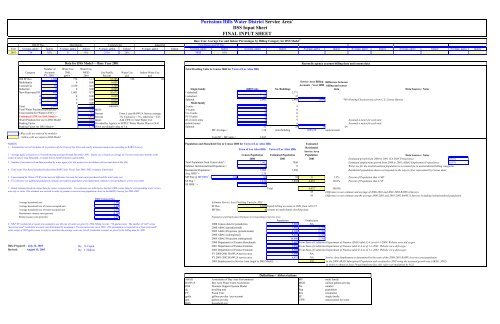
Purissima Hills <strong>Water</strong> District Service Area 1<br />
DSS Input Sheet<br />
FINAL INPUT SHEET<br />
Base Year Average Use and Indoor Percentages by Billing Category for DSS Model 2<br />
Old SF Res<br />
Multifamily<br />
Commercial<br />
Industrial<br />
New/Renovated SF Res<br />
Year Average, gpd/a Indoor Average, gpd/a Indoor Average, gpd/a Indoor Average, gpd/a Indoor Average, gpd/a Indoor Average, gpd/a Indoor Average, gpd/a Indoor Average, gpd/a Indoor Average, gpd/a Indoor Average, gpd/a Indoor<br />
2001 716 35% 0 0% 2530 26% 1605 16%<br />
Data for DSS Model - - Base Year 2001<br />
Reconcile agency account billing data and census data<br />
Number of <strong>Water</strong> Use <strong>Water</strong> Use,<br />
Total Dwelling Units in Census 2000 for Town of Los Altos Hills<br />
Category Accounts 2001 MGD Use Profile <strong>Water</strong> Use Indoor <strong>Water</strong> Use<br />
FY. 2001 3 gpd/a 2 2001 Percent gcd gcd<br />
Old SF Res 1,580 716 1.13 55.58% 188 66<br />
Multifamily 0 0 0.00 0.00%<br />
Service Area Billing Difference between<br />
Commercial 62 2,530 0.16 7.76%<br />
Accounts - Year 2000 billing and census<br />
Industrial 0 0 0.00 0.00%<br />
Single family<br />
2000 Units<br />
No. Buildings<br />
3<br />
data<br />
New/Renovated SF R 465 1,605 0.75 36.67% 1-detached 2,771 2,771<br />
0 0 0 0.00 0.00% 1-attached 32 32<br />
0 0 0 0.00 0.00% Subtotal 2,803 2,803 2,034 -769 Housing Characteristics from U.S. Census Bureau<br />
0 0 0 0.00 0.00% Multi family<br />
Total 2,107 2.04 100.00% 2-units 17 9<br />
Total <strong>Water</strong> Purchased (produced) 4 = 2.20 MGD 3-4 units 0 0<br />
Unaccounted For <strong>Water</strong> (UFW) 5 = 5% Percent From 5 year BAWUA Survey average 5 to 9 units 0 0<br />
Estimated UFW for DSS Model = 7.0% Percent 7% if actual is < 7%, otherwise = E25 10-19 units 0 0<br />
<strong>Water</strong> Produced for use in DSS Model 2.18 MGD Add UFW to Total <strong>Water</strong> Use 20 or more units 9 9<br />
Assumed a meter for each unit.<br />
Peaking Factor 1.78 Provided by Agency or <strong>SFPUC</strong> <strong>Water</strong> Master Plan (or NA) mobile homes 6 6<br />
Assumed a meter for each unit.<br />
Peaking Factor for DSS Model= 1.78 If NA use default value of 1.6. Subtotal 32 24 0 -24<br />
MF Average = 1.36 units/building #DIV/0! units/account<br />
- Blue cells are entered by modeler<br />
- Yellow cells are input to DSS Model Total SF + MF units = 2,835<br />
Data Sources / Notes<br />
NOTES Population and Household Size in Census 2000 for Town of Los Altos Hills Estimated<br />
1. - Communities served (includes all or portions of) the Town of Los Altos and nearby unincorporated areas according to BAWUA survey<br />
Residential<br />
Town of Los Altos Hills Town of Los Altos Hills<br />
Service Area<br />
2 - Average gpd/a is based on a 12-month moving average through December 2001. Indoor use is based on average of 2 lowest consecutive months in the<br />
Census Population Estimated Population Population<br />
winter if meters read bimonthly, or single lowest month if meters read monthly.<br />
3 - Number of accounts is from data provided by water agency for this project (see worksheet with account data in this file)<br />
4 - Total water Purchased (produced) taken from BAWUA for Fiscal Year 2001-2002 or agency if provided.<br />
5 - Unaccounted for <strong>Water</strong> (UFW) is the percent difference between the total water purchased and the total water use.<br />
6 - For reference see additional population estimates provided in population and employment estimates corresponding to service area table.<br />
7 - Initial estimate based on census data for renter occupied units. For reference see table below that has 2000 census data for corresponding water service<br />
area city or cities. This estimate was revised in order to produce a service area population closer to the BAWUA survey for 2001-2002.<br />
2000 Census Data<br />
Average household size 2.86 Estimate Service Area Dwelling Units for 2001<br />
Average household size of owner-occupied unit 2.88 SF Res 2,045 Equals billing accounts in 2001 from cell C15<br />
Average household size of renter-occupied unit 2.53 MF Res 0 Assume no multi-family dwelling units.<br />
Homeowner vacancy rate (percent) 0.70<br />
Rental vacancy rate (percent) 2.90 Population and Employment Estimates Corresponding to Service Area<br />
Population<br />
Employment<br />
8 -"Old" SF residencial accounts are assumed to use the rate of water use given by 1994 billing records: 716 gpd/account. The number of "old" versus<br />
"new/renovated" residential accounts was determined by assuming a 3% renovation rate since 1994. This assumption corresponds to a "new/renovated"<br />
water usage of 1605 gpd/account in order to maintain the average water use for all residential accounts as given by the billing data for 2001.<br />
Data Sources / Notes<br />
2000 2001 2001 Estimated growth from 2000 to 2001 (CA DOF <strong>Projections</strong>): 0.61%<br />
Total Population from Census data 6 = 7,902 7950 Estimated employment growth from 2000 to 2001 (ABAG Employment <strong>Projections</strong>): 0.07%<br />
Subtract Institutionalized Population = 0 0 <strong>Water</strong> use for the institutionalized population is accounted for in nonresidential billing categories<br />
Residential Population = 7,902 7,950 Residential population shown corresponds to the city or cities represented by Census data<br />
Avg. HHS 7 = 2.79<br />
MF Pop @ MF HHS 7 = 2.86 92 92 0 1.2% Percent of Population that is MF<br />
SF Pop = 7,810 7,858 6,032 98.8% Percent of Population that is SF<br />
SF HHS 7 = 2.95<br />
Total 6,032 100.0%<br />
95 Difference in our estimate and average of 2000-2001 and 2001-2002 BAWUA Surveys<br />
95 Difference in our estimate and the average 2000-2001 and 2001-2002 BAWUA Surveys including institutionalized population<br />
2000 Census data for jurisdiction 7,902 NA<br />
2000 ABAG (jurisdictional) 7,902 2,720<br />
2005 ABAG Projection (jurisdictional) 8,300 2,730<br />
2000 ABAG (subregional) 9,455 2,720<br />
2005 ABAG Projection (subregional) 10,000 2,730<br />
2000 Department of Finance Benchmark 7,902 From State of California Department of Finance (DOF) table E-4 as of 4-1-2000. Website www.dof.ca.gov<br />
Data Prepared : July 24, 2003 By: N. Foged 2001 Department of Finance Estimate 7,950 From State of California Department of Finance table E-4 as of 1-1-2001. Website www.dof.ca.gov<br />
Revised: August 15, 2003 By: J. Hudson 2002 Department of Finance Estimate 8,000 From State of California Department of Finance table E-4 as of 1-1-2002. Website www.dof.ca.gov<br />
FY 2000-2001 BAWUA service area 5,800 NA<br />
FY 2001-2002 BAWUA service area 6,075 NA Service Area Employment is determined by the ratio of the 2000-2001 BAWUA service area population<br />
2001 Employment in Service Area (input to DSS Model) = 420 to the 2000 ABAG Subregional Population and escalated to 2001 using the assumed growth rate (ABAG, 2002).<br />
In order to obtain at least 50 gal/employee/day, this value was multiplied by 0.25.<br />
Definitions / Abbreviations<br />
ABAG Association of Bay Area Governments MF multi family<br />
BAWUA Bay Area <strong>Water</strong> Users Association MGD million gallons per day<br />
DSS Decision Support System Model No. number<br />
du dwelling unit Pop population<br />
FY Fiscal Year Res residential<br />
gpd/a gallons per day / per account SF single family<br />
gpd gallons per day UFW unaccounted for water<br />
HHS<br />
household size


