

SFPUC Wholesale Customer Water Demand Projections ... - BAWSCA
SFPUC Wholesale Customer Water Demand Projections ... - BAWSCA
SFPUC Wholesale Customer Water Demand Projections ... - BAWSCA

You also want an ePaper? Increase the reach of your titles
YUMPU automatically turns print PDFs into web optimized ePapers that Google loves.
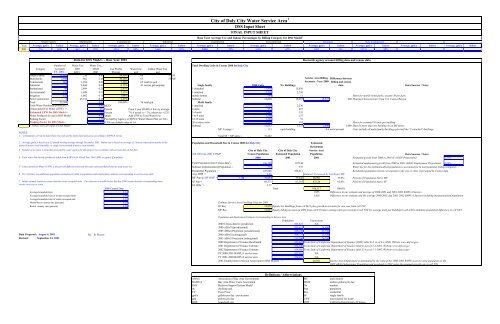
City of Daly City <strong>Water</strong> Service Area 1<br />
DSS Input Sheet<br />
FINAL INPUT SHEET<br />
Base Year Average Use and Indoor Percentages by Billing Category for DSS Model 2<br />
Single Family<br />
Multifamily<br />
Commercial<br />
Industrial<br />
Institutional<br />
Governmental<br />
Irrigation<br />
New Commercial<br />
Year Average, gpd/a Indoor Average, gpd/a Indoor Average, gpd/a Indoor Average, gpd/a Indoor Average, gpd/a Indoor Average, gpd/a Indoor Average, gpd/a Indoor Average, gpd/a Indoor Average, gpd/a Indoor Average, gpd/a Indoor<br />
2001 236 86% 862 87% 1054 89% 3460 85% 2494 78% 1699 67% 1082 0% 25732 89%<br />
Data for DSS Model - - Base Year 2001<br />
Reconcile agency account billing data and census data<br />
Number of <strong>Water</strong> Use <strong>Water</strong> Use,<br />
Total Dwelling Units in Census 2000 for Daly City<br />
Category Accounts 2001 MGD Use Profile <strong>Water</strong> Use Indoor <strong>Water</strong> Use<br />
FY. 2001 3 gpd/a 2 2001 Percent gcd gcd<br />
Single Family 18,683 236 4.41 54.50% 66 57 SF<br />
Multifamily 2,840 862 2.45 30.26% 63 55 MF<br />
Service Area Billing Difference between<br />
Commercial 664 1,054 0.60 7.38% 65 total res gcd<br />
Accounts - Year 2000 billing and census<br />
Industrial 3 3,460 0.01 0.13% 41 nonres gal/emp/day<br />
Single family<br />
2000 Units<br />
No. Buildings<br />
3<br />
data<br />
Data Sources / Notes<br />
Institutional 80 2,494 0.20 2.47% 1-detached 15,856 15,856<br />
Governmental 112 1,699 0.19 2.35% 1-attached 2,230 2,230<br />
Irrigation 123 1,082 0.13 1.64% mobile homes 544 11<br />
Meter for mobile home parks, assume 50 per park<br />
New Commercial 4 25,732 0.10 1.27% Subtotal 18,630 18,097 18,557 460 Housing Characteristics from U.S. Census Bureau<br />
Total 22,509 8.09 100.00% 76 total gcd Multi family<br />
Total <strong>Water</strong> Purchased (produced) 4 = 8.45 MGD 1-attached 2,230 2,230<br />
Unaccounted For <strong>Water</strong> (UFW) 5 = 6% Percent From 5 year BAWUA Survey average 2-units 934 467<br />
Estimated UFW for DSS Model = 7% Percent 7% if actual is < 7%, otherwise = E25 3-4 units 1,867 533<br />
<strong>Water</strong> Produced for use in DSS Model 8.66 MGD Add UFW to Total <strong>Water</strong> Use 5 to 9 units 1,100 157<br />
Peaking Factor 1.50 Provided by Agency or <strong>SFPUC</strong> <strong>Water</strong> Master Plan (or NA) 10-19 units 1,369 91<br />
Peaking Factor for DSS Model= 1.5 If NA use default value of 1.6. 20 or more units 5,112 102<br />
Meter for assumed 50 units per building<br />
- Yellow cells are input to DSS Model Subtotal 12,612 1,351 2,840 1,489 Must be more than one building on an MF meter.<br />
MF Average = 9.3 units/building 4.4 units/account Units include all multi-family dwellings plus half the "1-attached" dwellings.<br />
NOTES<br />
1. - Communities served includes Daly City and nearby unincorporated areas according to BAWUA survey<br />
Total SF + MF units = 31,242<br />
2 - Average gpd/a is based on a 12-month moving average through December 2001. Indoor use is based on average of 2 lowest consecutive months in the<br />
winter if meters read bimonthly, or single lowest month if meters read monthly.<br />
3 - Number of accounts is from data provided by water agency for this project (see worksheet with account data in this file)<br />
4 - Total water Purchased (produced) taken from BAWUA for Fiscal Year 2001-2002 or agency if provided.<br />
Population and Household Size in Census 2000 for Daly City<br />
Estimated<br />
Residential<br />
City of Daly City City of Daly City Service Area<br />
106,200 from 2001 UWMP Census Population Estimated Population Population<br />
Data Sources / Notes<br />
2000 2001 2001 Estimated growth from 2000 to 2001 (CA DOF <strong>Projections</strong>): 0.55%<br />
Total Population from Census data 6 = 106,200 107148 Estimated employment growth from 2000 to 2001 (ABAG Employment <strong>Projections</strong>): 0.89%<br />
5 - Unaccounted for <strong>Water</strong> (UFW) is the percent difference between the total water purchased and the total water use.<br />
Subtract Institutionalized Population = 532 537 <strong>Water</strong> use for the institutionalized population is accounted for in nonresidential billing categories<br />
Residential Population = 105,668 106,611 Residential population shown corresponds to the city or cities represented by Census data<br />
6 - For reference see additional population estimates provided in population and employment estimates corresponding to service area table.<br />
Avg. HHS 7 = 3.38 Subtract 414 served by Cal <strong>Water</strong> SSF<br />
MF Pop @ MF HHS 7 = 3.10 39,097 39,446 38,991 37.0% Percent of Population that is MF<br />
7 - Initial estimate based on census data for renter occupied units. For reference see table below that has 2000 census data for corresponding water<br />
SF Pop = 66,571 67,165 67,126 63.0% Percent of Population that is SF<br />
service area city or cities.<br />
SF HHS 7 = 3.57<br />
2000 Census Data Total 106,117 100.0%<br />
Average household size 3.34 1,955 Difference in our estimate and average of 2000-2001 and 2001-2002 BAWUA Surveys<br />
Average household size of owner-occupied unit 3.48 1,418 Difference in our estimate and the average 2000-2001 and 2001-2002 BAWUA Surveys including institutionalized population<br />
Average household size of renter-occupied unit 3.13<br />
Homeowner vacancy rate (percent) 0.30 Estimate Service Area Dwelling Units for 2001<br />
Rental vacancy rate (percent) 1.70 SF Res 18,858 Equals No. Buildings from cell M21 plus growth in accounts for one year from cell T38<br />
MF Res 12,627 Equals billing accounts in 2001 from cell C16 times average units per account in cell N30 (or average units per building in cell L30 to minimize population difference in cell N47)<br />
Population and Employment Estimates Corresponding to Service Area<br />
Population<br />
Employment<br />
2000 Census data for jurisdiction 103,621 NA<br />
2000 ABAG (jurisdictional) 103,621 24,650<br />
2005 ABAG Projection (jurisdictional) 106,100 25,750<br />
Data Prepared : August 4, 2003 By: B. Skeens 2000 ABAG (subregional) 108,777 25,150<br />
Revised: September 24, 2003 2005 ABAG Projection (subregional) 111,300 26,250<br />
2000 Department of Finance Benchmark 103,625 From State of California Department of Finance (DOF) table E-4 as of 4-1-2000. Website www.dof.ca.gov<br />
2001 Department of Finance Estimate 104,200 From State of California Department of Finance table E-4 as of 1-1-2001. Website www.dof.ca.gov<br />
2002 Department of Finance Estimate 104,000 From State of California Department of Finance table E-4 as of 1-1-2002. Website www.dof.ca.gov<br />
FY 2000-2001 BAWUA service area 103,916 NA<br />
FY 2001-2002 BAWUA service area 104,407 NA<br />
2001 Employment in Service Area (input to DSS Model) = 26,941 Service Area Employment is determined by the ratio of the 2000-2001 BAWUA service area population to the<br />
2000 ABAG Subregional Population and escalated to 2001 using the assumed growth rate in cell T39.<br />
Definitions / Abbreviations<br />
ABAG Association of Bay Area Governments MF multi family<br />
BAWUA Bay Area <strong>Water</strong> Users Association MGD million gallons per day<br />
DSS Decision Support System Model No. number<br />
du dwelling unit Pop population<br />
FY Fiscal Year Res residential<br />
gpd/a gallons per day / per account SF single family<br />
gpd gallons per day UFW unaccounted for water<br />
HHS household size DOF California Department of Finance


