Single family Multifamily Commercial Base Year Average Use and Indoor Percentages by Billing Category for DSS Model 2 Year Average, gpd/a Indoor Average, gpd/a Indoor Average, gpd/a Indoor Average, gpd/a Indoor Average, gpd/a Indoor Average, gpd/a Indoor Average 8 , gpd/a Indoor Average, gpd/a Indoor Average, gpd/a Indoor Average, gpd/a Indoor 2001 395 57% 1042 81% 1482 63% 4987 65% 5316 34% 1902 23% 265,592 0% Note: Accounts are read monthly Data for DSS Model - - Base Year 2001 Number of <strong>Water</strong> Use <strong>Water</strong> Use, Total Dwelling Units in Census 2000 for Palo Alto Category Accounts 2001 MGD Use Profile <strong>Water</strong> Use Indoor <strong>Water</strong> Use FY. 2001 3 gpd/a 2 2001 Percent gcd gcd Single family 14,515 395 5.73 43.12% 145 83 Multifamily 1,886 1,042 1.97 14.79% 96 78 Service Area Billing Difference between Commercial 1,629 1,482 2.41 18.17% Accounts - Year 2000 billing and census Industrial 247 4,987 1.23 9.28% Single family 2000 Units No. Buildings 3 data Data Sources / Notes Public Facility 64 5,316 0.34 2.54% 1-detached 15,387 15,387 Other 286 1,902 0.54 4.09% 1-attached 978 978 Recycled <strong>Water</strong> 4 265,592 1.06 8.00% Subtotal 16,365 16,365 14,771 -1,594 Housing Characteristics from U.S. Census Bureau 0 0 0.00 0.00% Multi family Total 18,631 13.28 100.00% 2-units 474 237 Total <strong>Water</strong> Purchased (produced) 4 = 13.53 MGD 3-4 units 1,254 358 Unaccounted For <strong>Water</strong> (UFW) 5 = 6.3% Percent From 5 year BAWUA Survey average 5 to 9 units 1,653 236 Estimated UFW for DSS Model = 7% Percent 7% if actual is < 7%, otherwise = E25 10-19 units 1,602 107 <strong>Water</strong> Produced for use in DSS Model 14.21 MGD Add UFW to Total <strong>Water</strong> Use 20 or more units 4,642 93 Meter for assumed 50 units per building Peaking Factor 1.50 Provided by Agency or <strong>SFPUC</strong> <strong>Water</strong> Master Plan (or NA) mobile homes 156 3 Meter for mobile home parks, assume 50 per park Peaking Factor for DSS Model= 1.5 If NA use default value of 1.6. Subtotal 9,781 1,034 1,929 895 Must be more than one building on an MF meter. MF Average = 9.46 units/building 5.07 units/account - Blue cells are entered by modeler - Yellow cells are input to DSS Model Total SF + MF units = 26,146 NOTES 1. - Communities served (includes all or portions of) Palo Alto and nearby unincorporated areas according to BAWUA survey Population and Household Size in Census 2000 for Palo Alto Estimated Residential City of Palo Alto City of Palo Alto Service Area Census Population Estimated Population Population 2 - Average gpd/a is based on a 12-month moving average through December 2001. Indoor use is based on average of 2 lowest consecutive months in the winter if meters read bimonthly, or single lowest month if meters read monthly. 3 - Number of accounts is from data provided by water agency for this project were taken from the BAWUA Survey. 4 - Total water Purchased (produced) taken from BAWUA for Fiscal Year 2001-2002 or agency if provided. For Palo Alto, the agency provided water purchase information. 5 - Unaccounted for <strong>Water</strong> (UFW) is the percent difference between the total water purchased and the total water use. 6 - For reference see additional population estimates provided in population and employment estimates corresponding to service area table. 7 - Initial estimate based on census data for renter occupied units. For reference see table below that has 2000 census data for corresponding water service area city or cities. Industrial Public Facility Palo Alto <strong>Water</strong> Service Area 1 DSS Input Sheet FINAL INPUT SHEET Reconcile agency account billing data and census data Data Sources / Notes 2000 2001 2001 Estimated growth from 2000 to 2001 (CA DOF <strong>Projections</strong>): 3.08% Total Population from Census data 6 = 58,598 60400 Estimated employment growth from 2000 to 2001 (ABAG Employment <strong>Projections</strong>): 0.20% Subtract Institutionalized Population = 433 446 <strong>Water</strong> use for the institutionalized population is accounted for in nonresidential billing categories Residential Population = 58,165 59,954 Residential population shown corresponds to the city or cities represented by Census data Avg. HHS 7 = 2.22 MF Pop @ MF HHS 7 = 2.03 19,855 20,466 20,466 34.1% Percent of Population that is MF SF Pop = 38,310 39,488 39,488 65.9% Percent of Population that is SF SF HHS 7 = 2.34 Total 59,954 100.0% 104 Difference in our estimate and average of 2000-2001 and 2001-2002 BAWUA Surveys -343 Difference in our estimate and the average 2000-2001 and 2001-2002 BAWUA Surveys including institutionalized population 2000 Census Data Average household size 2.30 Estimate Service Area Dwelling Units for 2001 Average household size of owner-occupied unit 2.55 SF Res 16,868 Equals No. Buildings from cell M21 plus growth in accounts for one year from cell T38 Average household size of renter-occupied unit 1.96 MF Res 10,082 Equals 2000 units from cell L29 plus the growth rate in accounts for one year from cell T38 Homeowner vacancy rate (percent) 0.60 Rental vacancy rate (percent) 2.00 Population and Employment Estimates Corresponding to Service Area Population Employment 8 - Average Recycled <strong>Water</strong> Usage per Account is the average of each of the 4 uses: water trucks, Greer Park, golf course and wastewater treatment plant. 2000 Census data for jurisdiction 58,598 NA 2000 ABAG (jurisdictional) 58,598 103,890 2005 ABAG Projection (jurisdictional) 61,200 104,920 2000 ABAG (subregional) 71,914 110,890 2005 ABAG Projection (subregional) 75,800 112,520 2000 Department of Finance Benchmark 58,598 From State of California Department of Finance (DOF) table E-4 as of 4-1-2000. Website www.dof.ca.gov Data Prepared : July 14, 2003 By: M. Maddaus 2001 Department of Finance Estimate 60,400 From State of California Department of Finance table E-4 as of 1-1-2001. Website www.dof.ca.gov Revised: June 8, 2004 2002 Department of Finance Estimate 60,400 From State of California Department of Finance table E-4 as of 1-1-2002. Website www.dof.ca.gov FY 2000-2001 BAWUA service area 59,350 NA FY 2001-2002 BAWUA service area 60,350 NA 2001 Employment in Service Area (input to DSS Model) = 105,432 Service Area Employment is determined by the ratio of the 2000-2001 BAWUA service area population to the 2000 ABAG Subregional Population and escalated to 2001 using the assumed growth rate in cell T39. (EXPLAIN SOURCE) Other Recycled <strong>Water</strong> Definitions / Abbreviations ABAG Association of Bay Area Governments MF multi family BAWUA Bay Area <strong>Water</strong> Users Association MGD million gallons per day DSS Decision Support System Model No. number du dwelling unit Pop population FY Fiscal Year Res residential gpd/a gallons per day / per account SF single family gpd gallons per day UFW unaccounted for water HHS household size
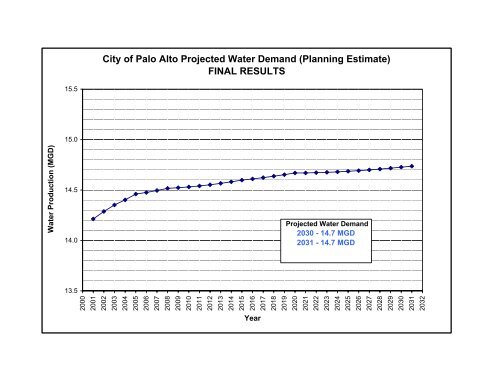
15.5 15.0 14.5 14.0 13.5 City of Palo Alto Projected <strong>Water</strong> <strong>Demand</strong> (Planning Estimate) FINAL RESULTS 2000 2001 2002 2003 2004 2005 2006 2007 2008 2009 2010 2011 2012 2013 2014 2015 2016 2017 2018 2019 2020 2021 2022 2023 2024 2025 2026 2027 2028 2029 2030 2031 2032 Projected <strong>Water</strong> <strong>Demand</strong> 2030 - 14.7 MGD 2031 - 14.7 MGD Year <strong>Water</strong> Production (MGD)
- Page 1 and 2:
San Francisco Public Utilities Comm
- Page 3 and 4:
List of Tables, Figures, and Append
- Page 5 and 6:
List of Tables, Figures, and Append
- Page 7 and 8:
Glossary Account Average gal/day/ac
- Page 9 and 10:
Executive Summary INTRODUCTION In F
- Page 11 and 12:
Section 1 Introduction
- Page 13 and 14:
SECTIONONE Introduction retail serv
- Page 15 and 16:
SECTIONONE Introduction 1.3 GENERAL
- Page 17 and 18:
Section 2 Approach to Developing Wa
- Page 19 and 20:
SECTIONTWO Approach to Developing W
- Page 21 and 22:
SECTIONTWO Approach to Developing W
- Page 23 and 24:
SECTIONTHREE Establishing Base - Ye
- Page 25 and 26:
SECTIONTHREE Establishing Base - Ye
- Page 27 and 28:
SECTIONTHREE Establishing Base - Ye
- Page 29 and 30:
SECTIONTHREE Establishing Base - Ye
- Page 31 and 32:
SECTIONTHREE Establishing Base - Ye
- Page 33 and 34:
SECTIONTHREE Establishing Base - Ye
- Page 35 and 36:
SECTIONTHREE Establishing Base - Ye
- Page 37 and 38:
SECTIONTHREE Establishing Base - Ye
- Page 39 and 40:
SECTIONTHREE Establishing Base - Ye
- Page 41 and 42:
SECTIONTHREE Establishing Base - Ye
- Page 43 and 44:
SECTIONTHREE Establishing Base - Ye
- Page 45 and 46:
SECTIONTHREE Establishing Base - Ye
- Page 47 and 48:
SECTIONTHREE Establishing Base - Ye
- Page 49 and 50:
Section 4 Water Demand Forecasting
- Page 51 and 52:
SECTIONFOUR Water Demand Forecastin
- Page 53 and 54:
SECTIONFOUR Water Demand Forecastin
- Page 55 and 56:
SECTIONFOUR Water Demand Forecastin
- Page 57 and 58:
Section 5 Water Demand Projections
- Page 59 and 60:
SECTIONFIVE Water Demand Projection
- Page 61 and 62:
SECTIONFIVE Water Demand Projection
- Page 63 and 64:
Section 6 References
- Page 65 and 66:
SECTIONSIX References Hayward, City
- Page 67 and 68:
Appendix A Description of SFPUC Who
- Page 69 and 70:
Appendix A Description of SFPUC Who
- Page 71 and 72:
Appendix A Description of SFPUC Who
- Page 73 and 74:
Appendix B Summary of Customer-Spec
- Page 75 and 76:
Wholesale Customer Estero MID/Foste
- Page 77 and 78:
Wholesale Customer Milpitas, City o
- Page 79 and 80:
Appendix B Summary of Customer-Spec
- Page 81 and 82:
Appendix C1 Alameda County Water Di
- Page 83 and 84:
66.0 64.0 62.0 60.0 58.0 56.0 54.0
- Page 85 and 86:
City of Brisbane Water Service Area
- Page 87 and 88:
Appendix C3 Burlingame, City of
- Page 89 and 90:
5.00 4.95 4.90 4.85 4.80 4.75 4.70
- Page 91 and 92: Cal Water Bear Gulch Water Service
- Page 93 and 94: Appendix C5 California Water Servic
- Page 95 and 96: 18.40 18.20 18.00 17.80 17.60 17.40
- Page 97 and 98: Cal Water South San Francisco (SSF)
- Page 99 and 100: Appendix C7 Coastside County Water
- Page 101 and 102: 4 3.8 3.6 3.4 3.2 3 2.8 2.6 2.4 2.2
- Page 103 and 104: City of Daly City Water Service Are
- Page 105 and 106: Appendix C9 East Palo Alto, City of
- Page 107 and 108: 5.0 4.5 4.0 3.5 3.0 2.5 2.0 City of
- Page 109 and 110: Estero Municipal Improvement Distri
- Page 111 and 112: Appendix C11 Guadalupe Valley Munic
- Page 113 and 114: 1.2 1.0 0.8 0.6 0.4 0.2 0.0 Guadalu
- Page 115 and 116: Base Year Average Use and Indoor Pe
- Page 117 and 118: Appendix C13 Hillsborough, Town of
- Page 119 and 120: 4.00 3.90 3.80 3.70 3.60 3.50 Town
- Page 121 and 122: Los Trancos Woods Northern, Blue Oa
- Page 123 and 124: Appendix C15 Menlo Park, City of
- Page 125 and 126: 5.2 5.0 4.8 4.6 4.4 4.2 4.0 3.8 3.6
- Page 127 and 128: Mid Peninsula (Belmont) Water Servi
- Page 129 and 130: Appendix C17 Millbrae, City of
- Page 131 and 132: 3.7 3.65 3.6 3.55 3.5 3.45 3.4 3.35
- Page 133 and 134: City of Milpitas Water Service Area
- Page 135 and 136: Appendix C19 Mountain View, City of
- Page 137 and 138: 15 14.9 14.8 14.7 14.6 14.5 14.4 14
- Page 139 and 140: North Coast County WD Water Service
- Page 141: Appendix C21 Palo Alto, City of
- Page 145 and 146: Purissima Hills Water District Serv
- Page 147 and 148: Appendix C23 Redwood City, City of
- Page 149 and 150: 14.5 14.0 13.5 13.0 12.5 12.0 11.5
- Page 151 and 152: City of San Bruno Water Service Are
- Page 153 and 154: Appendix C25 San Jose, City of (por
- Page 155 and 156: 7 6.9 6.8 6.7 6.6 6.5 6.4 6.3 6.2 6
- Page 157 and 158: City of Santa Clara Water Service A
- Page 159 and 160: Appendix C27 Skyline County Water D
- Page 161 and 162: 0.35 0.30 0.25 0.20 0.15 Skyline Co
- Page 163 and 164: Stanford University Water Service A
- Page 165 and 166: Appendix C29 Sunnyvale, City of
- Page 167 and 168: 28.0 27.0 26.0 25.0 24.0 23.0 City
- Page 169 and 170: Westborough County Water District S
- Page 171 and 172: Appendix D Summary of SFPUC Wholesa
- Page 173 and 174: Appendix D Summary of SFPUC Wholesa
- Page 175: Appendix D Summary of SFPUC Wholesa