

SFPUC Wholesale Customer Water Demand Projections ... - BAWSCA
SFPUC Wholesale Customer Water Demand Projections ... - BAWSCA
SFPUC Wholesale Customer Water Demand Projections ... - BAWSCA

You also want an ePaper? Increase the reach of your titles
YUMPU automatically turns print PDFs into web optimized ePapers that Google loves.
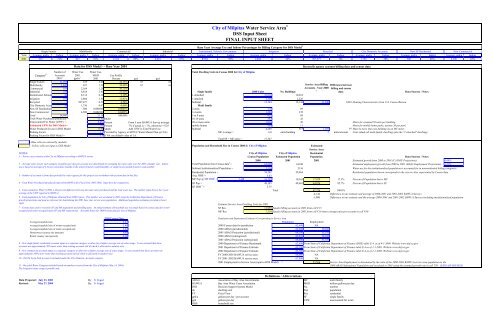
City of Milpitas <strong>Water</strong> Service Area 1<br />
DSS Input Sheet<br />
FINAL INPUT SHEET<br />
New SF Residential New Commercial<br />
Single Family<br />
Multifamily<br />
Commercial<br />
Industrial<br />
Institutional, Schools, Government<br />
Irrigation<br />
Recycled<br />
City Domestic Accounts<br />
Base Year Average Use and Indoor Percentages by Billing Category for DSS Model 2<br />
Year Average, gpd/a Indoor Average, gpd/a Indoor Average, gpd/a Indoor Average, gpd/a Indoor Average, gpd/a Indoor Average, gpd/a Indoor Average, gpd/a Indoor Average, gpd/a Indoor Average, gpd/a Indoor Average, gpd/a Indoor<br />
2001 325 71% 827 91% 2,164 89% 6,818 87% 8114 92% 2,804 34% 507,677 0% 1,756 38% 500 46% 4,500 43%<br />
Category 8 Accounts 2001 MGD Use Profile<br />
Data for DSS Model - - Base Year 2001<br />
Reconcile agency account billing data and census data<br />
Number of <strong>Water</strong> Use <strong>Water</strong> Use,<br />
Total Dwelling Units in Census 2000 for City of Milpitas<br />
2001 3 gpd/a 2 2001 Percent gcd gcd<br />
Single Family 11,955 325 3.89 34.75% 87 62<br />
Multifamily 1,445 827 1.20 10.69% 67 61<br />
Service Area Billing Difference between<br />
Commercial 555 2,164 1.20 10.73%<br />
Accounts - Year 2000 billing and census<br />
Industrial 354 6,818 2.41 21.55%<br />
Single family<br />
2000 Units<br />
No. Buildings<br />
3<br />
data<br />
Data Sources / Notes<br />
Institutional, Schools 44 8,114 0.36 3.19% 1-detached 10,918 10,918<br />
Irrigation 555 2,804 1.55 13.91% 1-attached 2,226 2,226<br />
Recycled 1 507,677 0.51 4.54% Subtotal 13,144 13,144 11,940 1,022 Housing Characteristics from U.S. Census Bureau<br />
City Domestic Accou 38 1,756 0.07 0.60% Multi family<br />
New SF Residential 1 500 0.000500 0.0045% 2-units 178 89<br />
New Commercial 1 4,500 0.004500 0.0402% 3-4 units 1,294 370<br />
Total 14,947 11.18 100.00% 5 to 9 units 622 89<br />
Total <strong>Water</strong> Purchased (produced) 4 = 11.52 MGD 10-19 units 543 36<br />
Unaccounted For <strong>Water</strong> (UFW) 5 = 5.6% Percent From 5 year BAWUA Survey average 20 or more units 1,016 20<br />
Meter for assumed 50 units per building.<br />
Estimated UFW for DSS Model = 7% Percent 7% if actual is < 7%, otherwise = E25 mobile homes 550 11<br />
Meter for mobile home parks, assume 50 per park.<br />
<strong>Water</strong> Produced for use in DSS Model 11.96 MGD Add UFW to Total <strong>Water</strong> Use Subtotal 4,203 615 1,269 97 Must be more than one building on an MF meter.<br />
Peaking Factor 1.9 Provided by Agency or <strong>SFPUC</strong> <strong>Water</strong> Master Plan (or NA) MF Average = 6.8 units/building 5 units/account Units inlude all multi-family dwellings plus the "1-attached" dwellings.<br />
Peaking Factor for DSS Model = 1.9 If NA use default value of 1.6.<br />
Total SF + MF units = 17,347<br />
- Blue cells are entered by modeler<br />
- Yellow cells are input to DSS Model Population and Household Size in Census 2000 forCity of Milpitas Estimated<br />
Service Area<br />
NOTES City of Milpitas City of Milpitas Residential<br />
1. - Service area consists of the City of Milpitas according to BAWUA survey Census Population Estimated Population Population<br />
Data Sources / Notes<br />
2000 2001 2001 Estimated growth from 2000 to 2001 (CA DOF <strong>Projections</strong>): 0.64%<br />
2 - Average water use for each category in gallons-per-day-per-account was determined by averaging the water sales over the 2001 calander year. Indoor<br />
Total Population from Census data 6 = 62,698 63100 Estimated employment growth from 2000 to 2001 (ABAG Employment <strong>Projections</strong>): 1.21%<br />
use is based on average of 2 lowest consecutive months in the winter if meters read bimonthly, or single lowest month if meters read monthly.<br />
Subtract Institutionalized Population = 3,116 3136 <strong>Water</strong> use for the institutionalized population is accounted for in nonresidential billing categories<br />
Residential Population = 59,582 59,964 Residential population shown corresponds to the city or cities represented by Census data<br />
3 - Number of accounts is from data provided by water agency for this project (see worksheet with account data in this file)<br />
Avg. HHS 7 = 3.43<br />
MF Pop @ MF HHS 7 = 2.45 10,297 10,363 17,929 17.3% Percent of Population that is MF<br />
4 - Total <strong>Water</strong> Purchased (produced) taken from BAWUA for Fiscal Year 2001-2002. Input here for comparison.<br />
SF Pop = 49,285 49,601 44,826 82.7% Percent of Population that is SF<br />
SF HHS 7 = 3.75<br />
5 - Unaccounted for <strong>Water</strong> (UFW) is the percent difference between the total water purchased and the total water use. The number input here is the 5-year<br />
Total 62,756 100.0%<br />
average of the UFW reported to BAWUA.<br />
-4,144 Difference in our estimate and average of 2000-2001 and 2001-2002 BAWUA Surveys<br />
6 - Total population for City of Milpitas obtained from 2000 Census. This number was escalated to 2001 using the California Department of Finance<br />
-1,008 Difference in our estimate and the average 2000-2001 and 2001-2002 BAWUA Surveys including institutionalized population<br />
growth projections and used as reference for determining the 2001 base year service area population. Additional population estimates provided at lower<br />
right.<br />
Estimate Service Area Dwelling Units for 2001<br />
7 - Census data used to reconsile SF and MF population and dwelling units. An initial estimate of household size was made based on census data for owneroccupied<br />
SF Res<br />
11,955 Equals billing accounts in 2001 from cell C15<br />
and renter-occupied units (SF and MF respectively). See table below for 2000 Census data for City of Milpitas.<br />
MF Res<br />
7,318 Equals billing accounts in 2001 from cell C16 times average units per account in cell<br />
N30<br />
2000 Census Data Population and Employment Estimates Corresponding to Service Area<br />
Average household size 3.47 Population Employment<br />
Average household size of owner-occupied unit 3.49 2000 Census data for jurisdiction 62,698 NA<br />
Average household size of renter-occupied unit 3.44 2000 ABAG (jurisdictional) 62,698 50,280<br />
Homeowner vacancy rate (percent) 0.40 2005 ABAG Projection (jurisdictional) 68,300 53,310<br />
Rental vacancy rate (percent) 2.10 2000 ABAG (subregional) 62,810 50,280<br />
8 - New single family residential accounts input as a separate category to allow for a higher average rate of water usage. It was assumed that these<br />
accounts use approximately 50% more water than existing accounts (all of which is allocated to outdoor use).<br />
9 - New commercial accounts input as a separate category to allow for a higher average rate of water usage. It was assumed that these accounts use<br />
approximately 100% more water than existing accounts (all of which is allocated to outdoor use).<br />
10 - The Ed Levin Park account is included under the City Domestic Accounts category.<br />
11 - Recycled <strong>Water</strong> Category included based on numbers received from the City of Milpitas (May 14, 2004.)<br />
The Irrigation water usage is potable only.<br />
2005 ABAG Projection (subregional) 68,400 53,310<br />
2000 Department of Finance Benchmark 62,698 From State of California Department of Finance (DOF) table E-4 as of 4-1-2000. Website www.dof.ca.gov<br />
2001 Department of Finance Estimate 63,100 From State of California Department of Finance table E-4 as of 1-1-2001. Website www.dof.ca.gov<br />
2002 Department of Finance Estimate 63,700 From State of California Department of Finance table E-4 as of 1-1-2002. Website www.dof.ca.gov<br />
FY 2000-2001 BAWUA service area 66,000 NA<br />
FY 2001-2002 BAWUA service area 67,800 NA<br />
2001 Employment in Service Area (input to DSS Model) = 53,566 Service Area Employment is determined by the ratio of the 2000-2001 BAWUA service area population to the<br />
2000 ABAG Subregional Population and escalated to 2001 using the assumed growth rate in cell T39. (EXPLAIN SOURCE)<br />
Definitions / Abbreviations<br />
Data Prepared : July 23, 2003 By: N. Foged ABAG Association of Bay Area Governments MF multi family<br />
Revised: May 27, 2004 By: N. Foged BAWUA Bay Area <strong>Water</strong> Users Association MGD million gallons per day<br />
DSS Decision Support System Model No. number<br />
du dwelling unit Pop population<br />
FY Fiscal Year Res residential<br />
gpd/a gallons per day / per account SF single family<br />
gpd gallons per day UFW unaccounted for water<br />
HHS<br />
household size


