

SFPUC Wholesale Customer Water Demand Projections ... - BAWSCA
SFPUC Wholesale Customer Water Demand Projections ... - BAWSCA
SFPUC Wholesale Customer Water Demand Projections ... - BAWSCA

You also want an ePaper? Increase the reach of your titles
YUMPU automatically turns print PDFs into web optimized ePapers that Google loves.
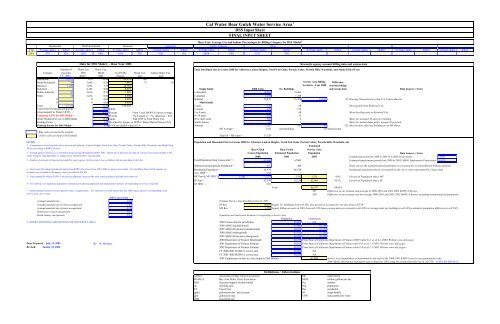
Cal <strong>Water</strong> Bear Gulch <strong>Water</strong> Service Area 1<br />
DSS Input Sheet<br />
FINAL INPUT SHEET<br />
Base Year Average Use and Indoor Percentages by Billing Category for DSS Model 2<br />
Residential<br />
Multi Residential<br />
Business<br />
Industrial<br />
Public Authority<br />
Other<br />
Year Average, gpd/a Indoor Average, gpd/a Indoor Average, gpd/a Indoor Average, gpd/a Indoor Average, gpd/a Indoor Average, gpd/a Indoor Average, gpd/a Indoor Average, gpd/a Indoor Average, gpd/a Indoor Average, gpd/a Indoor<br />
2001 670 42% 3692 86% 1054 78% 4183 8% 2614 34% 1632 78%<br />
Data for DSS Model - - Base Year 2001<br />
Reconcile agency account billing data and census data<br />
Number of <strong>Water</strong> Use <strong>Water</strong> Use,<br />
Total Dwelling Units in Census 2000 for Atherton, Ladera Heights, North Fair Oaks, Portola Valley, Portola Hills, Woodside, and Menlo Park (West)<br />
Category Accounts 2001 MGD Use Profile <strong>Water</strong> Use Indoor <strong>Water</strong> Use<br />
FY. 2001 3 gpd/a 2 2001 Percent gcd gcd<br />
Residential 15,875 670 10.64 84.85% 169 71<br />
Multi Residential 64 3,692 0.24 1.88% 73 63<br />
Service Area Billing Difference<br />
Business 1,280 1,054 1.35 10.76%<br />
Accounts - Year 2000 between billing<br />
Industrial 1 4,183 0.00 0.03%<br />
Single family<br />
2000 Units<br />
No. Buildings<br />
3<br />
and census data<br />
Data Sources / Notes<br />
Public Authority 95 2,614 0.25 1.98% 1-detached 14,462 14,462<br />
Other 38 1,632 0.06 0.50% 1-attached 1,239 1,239<br />
0 0 0.00 0.00% Subtotal 15,837 15,769 15,816 47 Housing Characteristics from U.S. Census Bureau<br />
0 0 0.00 0.00% Multi family<br />
Total 17,354 12.54 100.00% 2-units 136 68<br />
Move people from Redwood City<br />
Total <strong>Water</strong> Purchased (produced) 4 = 12.96 MGD 3-4 units 439 125<br />
Unaccounted For <strong>Water</strong> (UFW) 5 = 4.3% Percent From 5 year BAWUA Survey average 5 to 9 units 278 40<br />
Move dwelling units to Redwood City<br />
Estimated UFW for DSS Model = 7% Percent 7% if actual is < 7%, otherwise = E25 10-19 units 218 15<br />
<strong>Water</strong> Produced for use in DSS Model 13.42 MGD Add UFW to Total <strong>Water</strong> Use 20 or more units 300 6<br />
Meter for assumed 50 units per building<br />
Peaking Factor 1.75 Provided by Agency or <strong>SFPUC</strong> <strong>Water</strong> Master Plan (or NA) mobile homes 58 1<br />
Meter for mobile home parks, assume 50 per park<br />
Peaking Factor for DSS Model= 1.75 If NA use default value of 1.6. Subtotal 1,292 187 64 -123 Must be more than one building on an MF meter.<br />
MF Average = 6.92 units/building 20 units/account<br />
- Blue cells are entered by modeler<br />
- Yellow cells are input to DSS Model Total SF + MF units = 17,129<br />
NOTES<br />
1. - Communities served (includes all or portions of) Atherton, Ladera Heights, North Fair Oaks, Portola Valley, Portola Hills, Woodside, and Menlo Park<br />
(West) according to BAWUA survey<br />
2 - Average gpd/a is based on a 12-month moving average through December 2001. Indoor use is based on average of 2 lowest consecutive months in the<br />
winter if meters read bimonthly, or single lowest month if meters read monthly.<br />
3 - Number of accounts is from data provided by water agency for this project (see worksheet with account data in this file)<br />
Population and Household Size in Census 2000 for Atherton, Ladera Heights, North Fair Oaks, Portola Valley, Portola Hills, Woodside, and<br />
Estimated<br />
Bear Gulch Bear Gulch Service Area<br />
Census Population Estimated Population Population<br />
Data Sources / Notes<br />
2000 2001 2001 Estimated growth from 2000 to 2001 (CA DOF <strong>Projections</strong>): 1.59%<br />
Total Population from Census data 6 = 65,960 67009 Estimated employment growth from 2000 to 2001 (ABAG Employment <strong>Projections</strong>): -0.47%<br />
Subtract Institutionalized Population = 481 489 <strong>Water</strong> use for the institutionalized population is accounted for in nonresidential billing categories<br />
4 - Total water Purchased (produced) taken from BAWUA for Fiscal Year 2001-2002 or agency if provided. For Cal <strong>Water</strong> Bear Gulch, number of<br />
Residential Population = 65,479 66,520 Residential population shown corresponds to the city or cities represented by Census data<br />
accounts was provided by the agency and is provided in this file.<br />
Avg. HHS 7 = 3.82<br />
5 - Unaccounted for <strong>Water</strong> (UFW) is the percent difference between the total water purchased and the total water use.<br />
MF Pop @ MF HHS 7 = 2.50 3,231 3,282 3,231 4.9% Percent of Population that is MF<br />
SF Pop = 62,248 63,238 62,966 95.1% Percent of Population that is SF<br />
6 - For reference see additional population estimates provided in population and employment estimates corresponding to service area table.<br />
SF HHS 7 = 3.93<br />
Total 66,197 100.0%<br />
7 - Initial estimate based on census data for renter occupied units. For reference see table below that has 2000 census data for corresponding water<br />
107 Difference in our estimate and average of 2000-2001 and 2001-2002 BAWUA Surveys<br />
service area city or cities.<br />
-382 Difference in our estimate and the average 2000-2001 and 2001-2002 BAWUA Surveys including institutionalized population<br />
2000 Census Data<br />
Average household size 2.84 Estimate Service Area Dwelling Units for 2001<br />
Average household size of owner-occupied unit 2.82 SF Res 16,019 Equals No. Buildings from cell M21 plus growth in accounts for one year from cell T38<br />
Average household size of renter-occupied unit 2.75 MF Res 1,292 Equals billing accounts in 2001 from cell C16 times average units per account in cell N30 (or average units per building in cell L30 to minimize population difference in cell N47)<br />
Homeowner vacancy rate (percent) 0.37<br />
Rental vacancy rate (percent) 2.27 Population and Employment Estimates Corresponding to Service Area<br />
Population<br />
Employment<br />
8 -(INSERT ADDITIONAL ASSUMPTIONS FOR THIS SERVICE AREA)<br />
2000 Census data for jurisdiction 65,960 NA<br />
2000 ABAG (jurisdictional) 67,003 43,784<br />
2005 ABAG Projection (jurisdictional) 69,267 42,750<br />
2000 ABAG (subregional) 47,423 27,142<br />
2005 ABAG Projection (subregional) 46,838 26,183<br />
2000 Department of Finance Benchmark 68,759 From State of California Department of Finance (DOF) table E-4 as of 4-1-2000. Website www.dof.ca.gov<br />
Data Prepared : July 23, 2003 By: M. Maddaus 2001 Department of Finance Estimate 69,852 From State of California Department of Finance table E-4 as of 1-1-2001. Website www.dof.ca.gov<br />
Revised: January 8, 2004 2002 Department of Finance Estimate 69,957 From State of California Department of Finance table E-4 as of 1-1-2002. Website www.dof.ca.gov<br />
FY 2000-2001 BAWUA service area 65,960 NA<br />
FY 2001-2002 BAWUA service area 66,220 NA<br />
2001 Employment in Service Area (input to DSS Model) = 42,899 Service Area Employment is determined by the ratio of the 2000-2001 BAWUA service area population to the<br />
2000 ABAG Subregional Population and escalated to 2001 using the assumed growth rate in cell T39. (EXPLAIN SOURCE)<br />
Definitions / Abbreviations<br />
ABAG Association of Bay Area Governments MF multi family<br />
BAWUA Bay Area <strong>Water</strong> Users Association MGD million gallons per day<br />
DSS Decision Support System Model No. number<br />
du dwelling unit Pop population<br />
FY Fiscal Year Res residential<br />
gpd/a gallons per day / per account SF single family<br />
gpd gallons per day UFW unaccounted for water<br />
HHS<br />
household size


